NPLS Playoffs Update 7/25/21
July 26, 2021
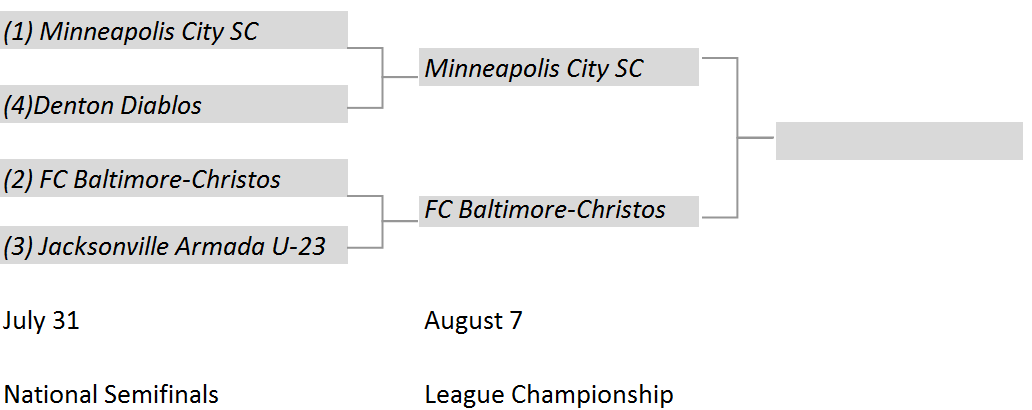
After 36 playoff matches whittled a field of 40 down to four, we have finally know the four clubs who are representing their regions in the National Premier Soccer League’s national semifinals. Drama and a relatively undramatic, yet significant, upset defined the region finals. Here is what happened:
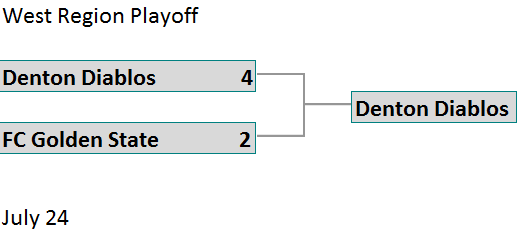
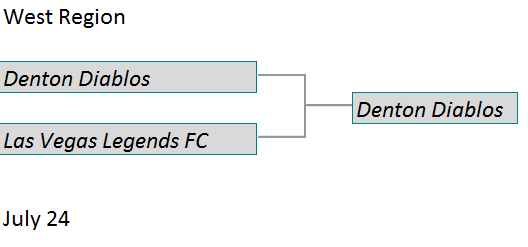
On a hot night in Denton Texas (96° at kickoff), Los Angeles County based FC Golden State took a first-half lead against the hosts, Denton Diablos. Eduardo Faria (Porto Alegre, Brazil) scored his third goal of the playoffs in the fifth minute of the match then added another goal in the 44th. Just when one thought that the match was going to halftime at 0-2, Denton managed to put in a shot that Golden State’s goalkeeper failed to scoop up and James Doyle (Merseyside, England)was able to clean up and score his third goal in as many games***. Denton trailed for most of the second half until Trevor Amann (Midwestern State University, Westminster, CO), leveled the match in the 77th minute; having notched braces in both conference playoff matches, the goal was officially his fifth of the playoffs.
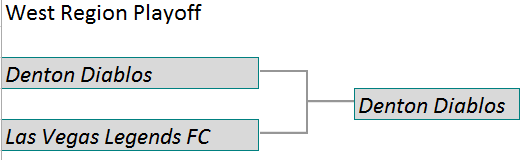
Denton did not waste time waiting to secure the match. Four minutes after the equalizer, 23 year-old defender Carlos Manriquez gave his squad the lead. Julian Barajas (Midwestern State University, Fort Worth, TX) tallied the insurance marker in the 87th minute. After losing to Lone Star Vaqueros in the 2019 Lone Star Conference semifinal, Denton advances advances to the national semifinals in its second season of NPSL play.
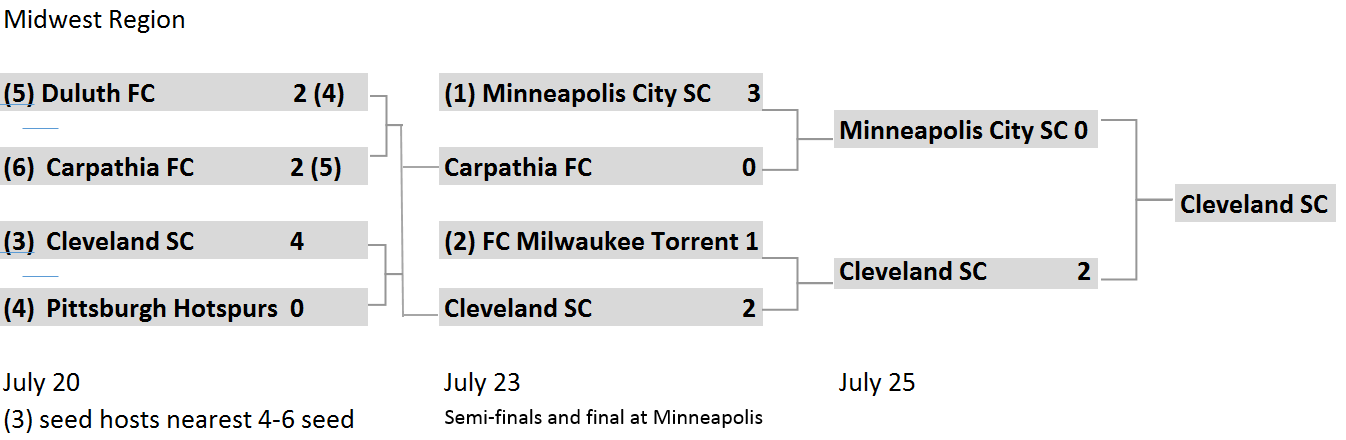
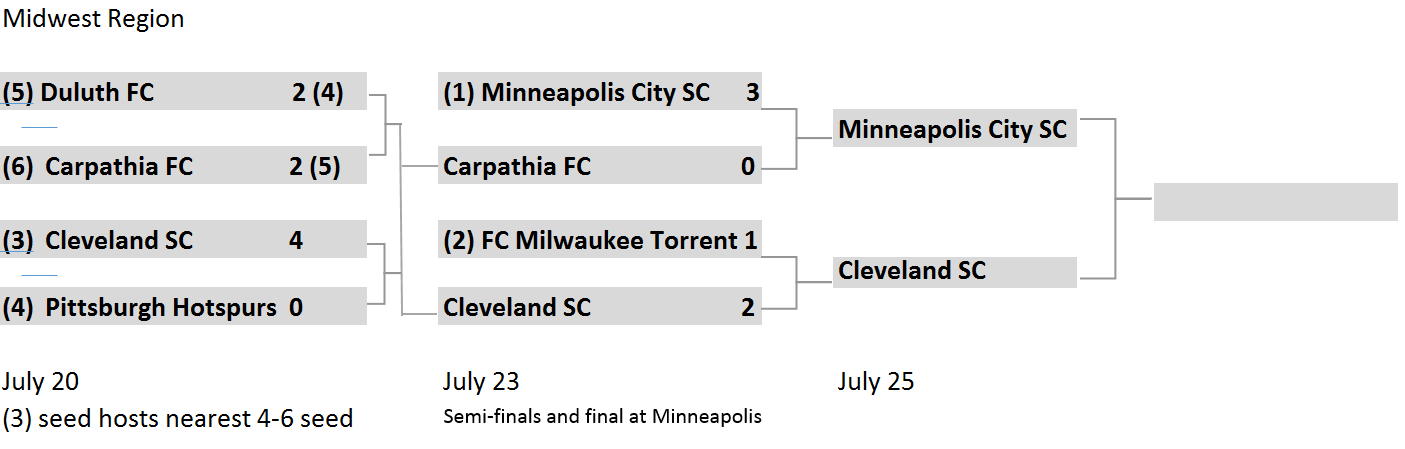
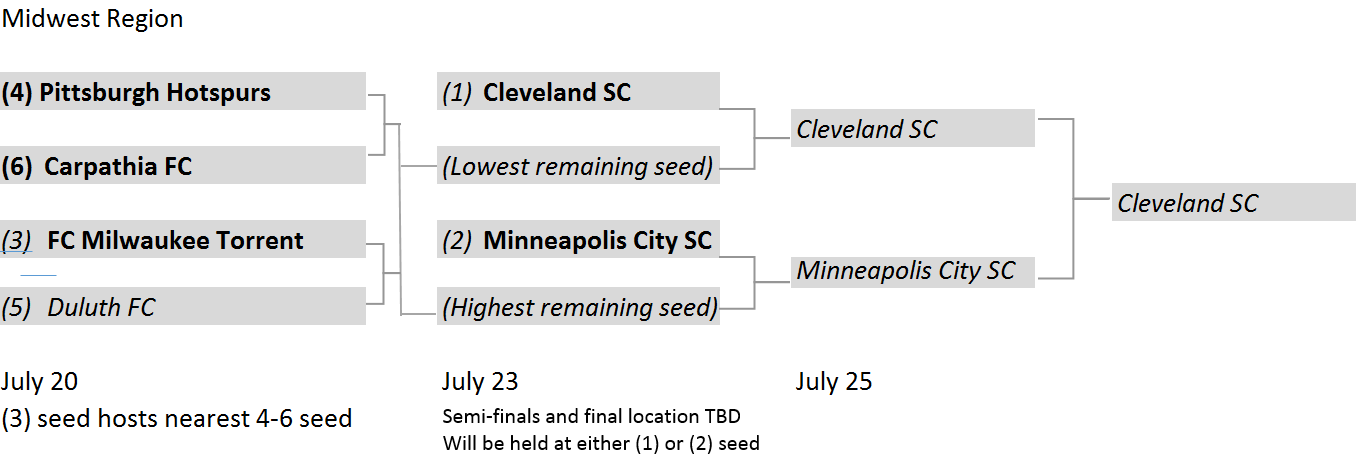
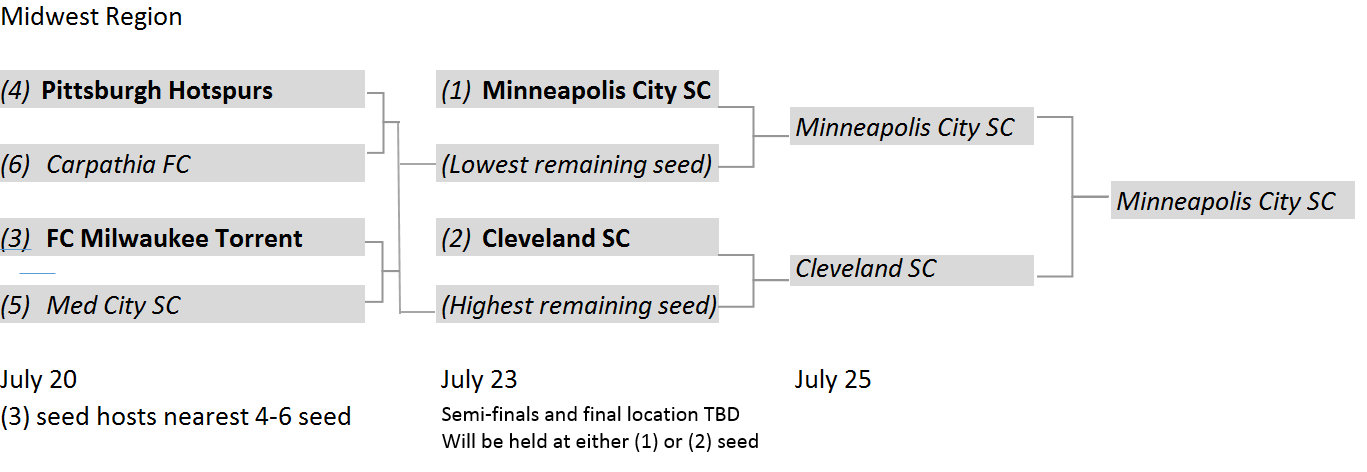
The upset of the region finals occurred in Minnesota as Cleveland SC defeated top seed Minneapolis City SC. In the 21st minute, Cleveland soccer veteran Admir Suljevic (Derventa, Bosnia-Herzegovina) scored his third goal of the playoffs to give the vistors the lead. Per Minneapolis’ game day Twitter account, the home side bounced two shots off the frame of goal in the first half, which ended with Cleveland having the one goal lead. In the second half, Minneapolis continued to have the better part of the opportunities, yet Corbin McAvinew (Canal Fulton, Ohio) scored for Cleveland in the 69th minute. Per Minneapolis’ account Cleveland had only two opportunities but two were all that were needed for two goals and Cleveland won the Midwest Region to advance to its second national semifinals in its third season of play (it lost to eventual champion Miami FC in 2019).

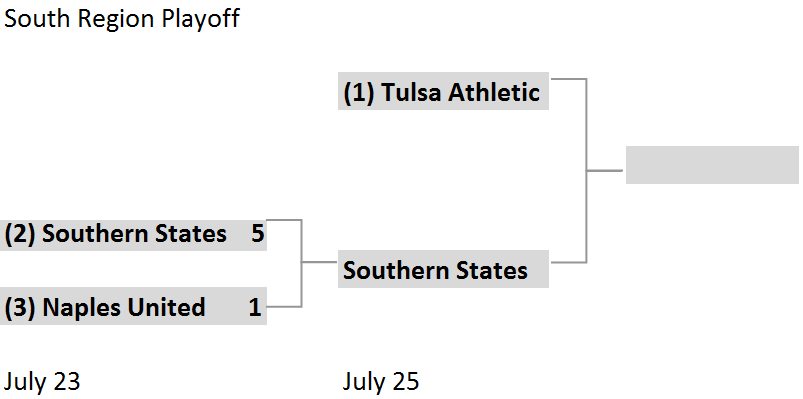
In the South Region finals, Tulsa Athletic took an early lead on Hattiesburg, Mississippi side Southern States Soccer Club via Munashe Raranje’s (Harare, Zimbabwe) put-away of a rebound in the eighth minute. The visitors were quick to respond as Samuel Dadzie (Sacramento, CA, previously with USL league 2 side Ventura County Fusion) scored an equalizing goal two minutes later. The match remained level at 1-1 through the balance of the first half and through the second half as well. Just when everyone thought Tulsa was headed to its second penalty session of the playoffs…
…Riolan Mello (Salvador, Brazil) scored in stoppage time for Tulsa. After falling two South Region finals (to eventual champion Miami FC in 2019 and to Chattanooga FC in 2014), Tulsa is in the national semifinals for the first time in its eighth season of NPSL play.
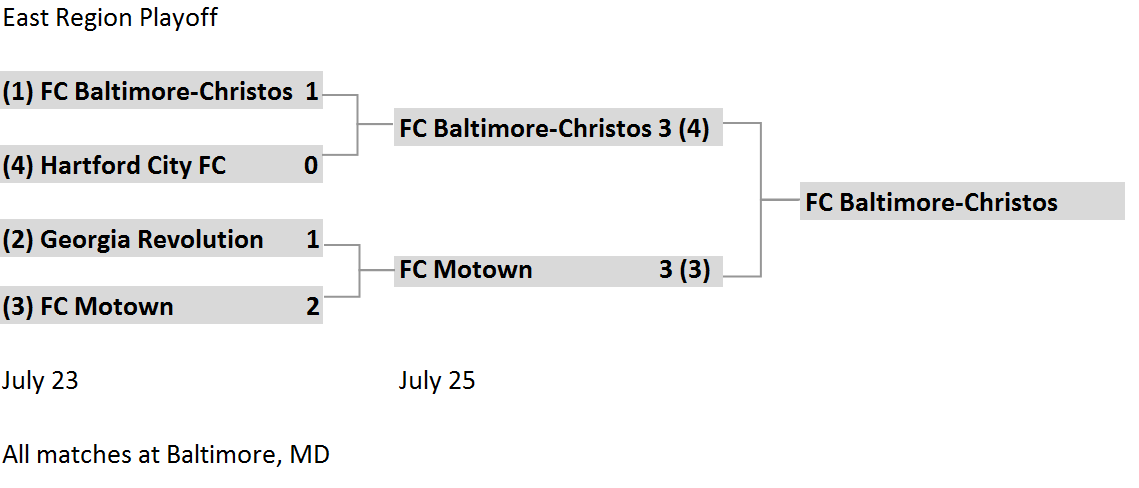
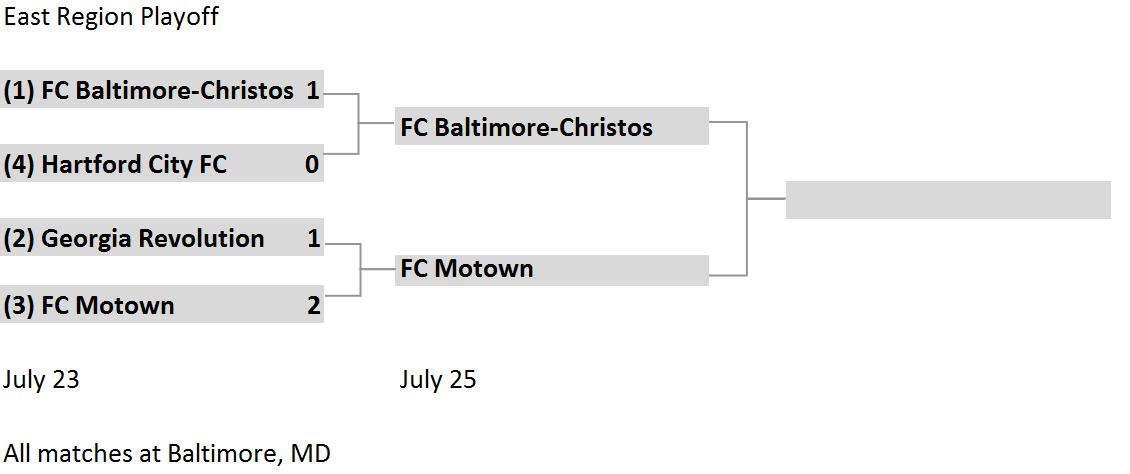
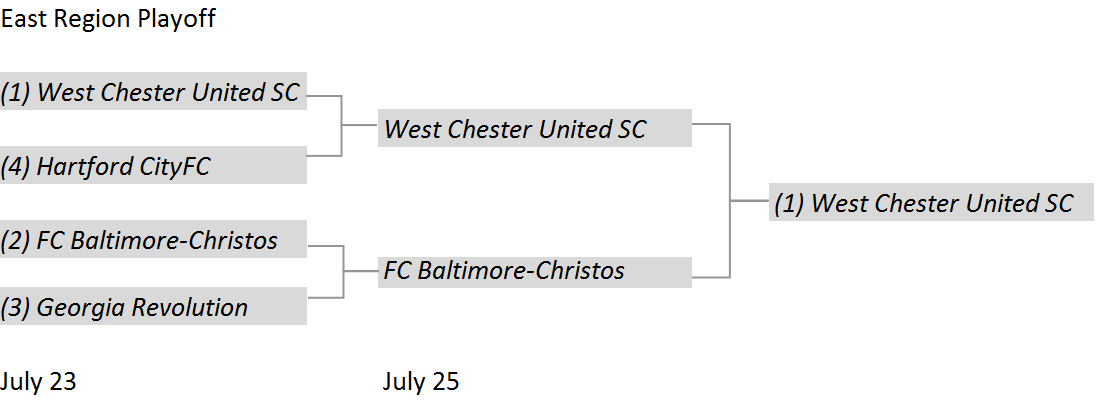
So, we’ve covered a team overcoming a two goal deficit, the top seed of the playoffs falling out, and a match decided at the death and we have yet to cover the most exciting match of the bunch! FC Baltimore Christos and FC Motown contested an epic East Region final. The home side entered the match knowing of Minneapolis’s loss, which meant that Baltimore could now grab home field advantage for the national semifinals and final.
Ben Stitz (University of Pennsylvania, Baltimore, MD), in the fifth minute, scored his second goal of the playoffs to give Baltimore an early lead. FC Motown gave Michael Zierhoffer (Arnold, MD, also of MASL side Baltimore Blast) plenty of work in the first half, yet Baltimore carried the lead into the break.
Federico de Oliveira (Kenilworth, N.J.) equalized the match in the 62nd minute. Jordan Travers (Clarksburg, MD) put the home side back in the lead five minutes later. Nearly 20 minutes passed before Eddy Enowbi (Silver Spring, Md) brought the match level yet again. David Harris (Waimanalo, Hawaii) put Baltimore back ahead in the 90th minute. But then, Orlando Neto (Cliffside Park, NJ, via Teixeira de Freitas, Brazil) scored his second of goal of the playoffs in stoppage time to bring the match level at three!
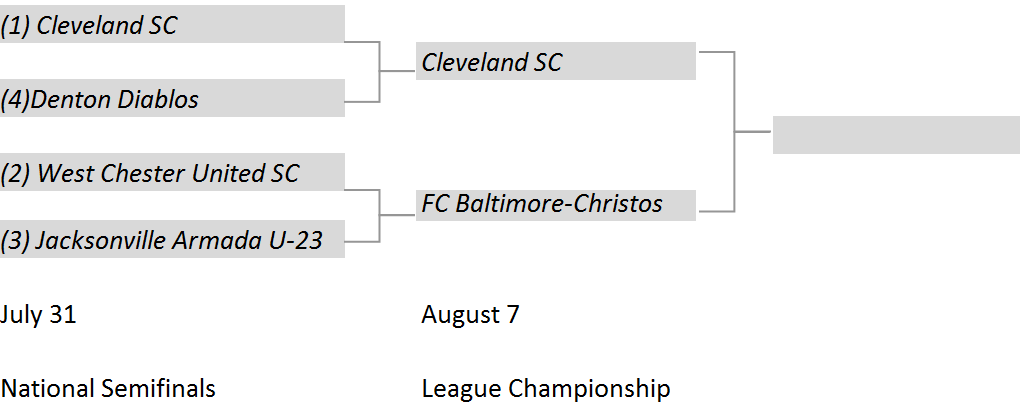
The match went to penalty kicks. Baltimore failed to convert its third, but Motown failed on its fourth. Baltimore then converted its fifth and a second failed attempt by Motown made FC Baltimore Christos the East Region champions. This will be their first national semifinal appearance in three seasons of play.
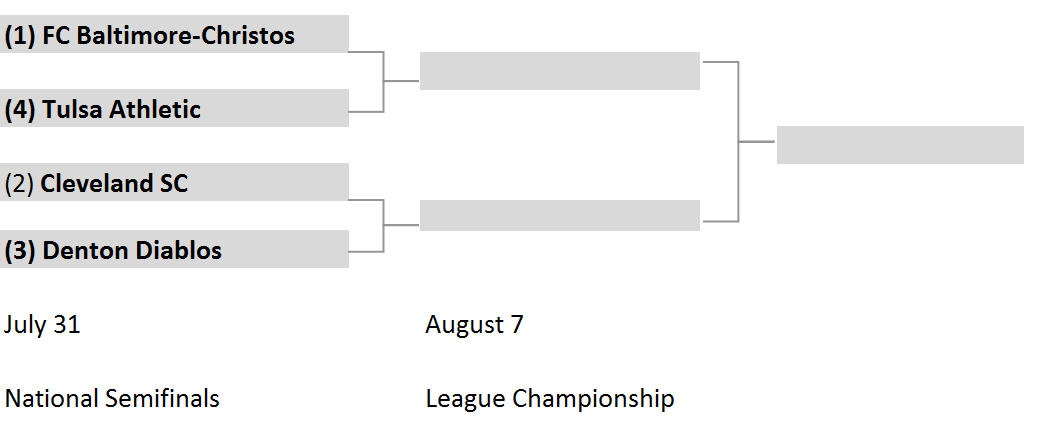
The national semifinals are scheduled for Saturday, July 31 (times have yet to been released). FC Baltimore Christos will host Tulsa Athletic and Denton Diablos will make the trip to Cleveland. The winners will advance to the August 7 championship match to be hosted by the higher remaining seed. The next post will be published on Friday.
***Denton’s account of the match credits the goal to Trevor Amann. However, the NPSL match report credits the goal to Doyle. It is the official policy of Eye of the Storm to follow the match report in such instances, when the editorial staff are unable to personally confirm that the match report is, in fact, in error.
NPSL Playoffs Update 7/24/21
July 24, 2021
Yesterday’s regional semifinal matches featured a balanced mix of close and not-so close matches, some normal, some not-so-much.
In the South Region semifinal, Southern States got on the board early with a point-blank header put in the net by John Cozine (Decatur, GA formerly of ULS League 2 side Daytona Rush SC via Danny Reynolds’ corner kick in the sixth minute. Reynolds (Shilton, England), who was selected in the second round of the 2020 MLS draft by Seattle Sounders and is the brother of Southern States’ coach Carl Reynolds, added to the home team’s lead with a rifle shot of a shot from just outside the box in the 30th minute. Naples United appeared to settle into the match, however, and Jonathan Gonzalez (Alta Gracia, Argentina) scored his fourth goal of the playoffs in the 36th minute with a low angle chip of the goalkeeper. As such, it looked like we were in for a close match. But six minutes later, Julian Avila-Good (Winnipeg, Canada) headed the ball in from a Cozine cross. Then, two minutes later, Diego Resquin (born in New York City, grew up in Paraguay, previously of Miami United) already on a yellow card from the 18th minute, received a second on for a hard tackle. On the ensuing free kick, Liam Bennett (Leeds, England, previously of Leeds United academy and Ocean City Nor’easters) converted Danny Reynolds’ service into a goal to give his side a 4-1 lead before the end of the first half.
Southern States’ otherwise bright evening would be marred by an altercation in the 75th minute. Reynolds was on the receiving end of a wild tackle by Jonathan Gonzalez, for which the perpetrator would immediately receive a red card. While Reynolds was down, another Naples United player stood over him (and according to the announcer) grabbed his hair. Reynolds then got up and shoved his harasser; the act would net him a red card. The incident led to a drawn-out lively argument in which Gonzalez shoved the referee (well after being carded). After the match finally resumed, Andre Deas (Atlanta, GA, previously of USL Championship’s Hartford Athletic) scored in the 84th minute to wrap up the match. Southern States will now make the 600+ mile trip to Tulsa for the South Region final versus Tulsa Athletic. They will do so without their top goal-scorer due to Reynolds’ moment of overflowing frustration. The match is scheduled for 4:00 PM on Sunday.
In the first East Region semifinal match, Georgia Revolution took the lead on a goal scored by Adam Kirkwood (Stranraer, Scotland, also of USL League 2’s South Carolina United Bantams) in the 40th minute. Georgia, who were fresh off a 16 hour journey that ended with their arrival in Baltimore at 2 AM on game-day, held the lead well into the second half before Motown equalized with a 77th minute goal officially credited to Orlando Neto (Cliffside Park, NJ, via Teixeira de Freitas, Brazil) but the club’s Twitter feed credited to Julian Gomez (Monmouth College, Fairfield, NJ). Roy Boateng (Accra, Ghana, previously of New York Red Bulls II) then scored via a late header to give FC Motown the victory.
They will face FC Baltimore Christos in the region final. Baltimore received a penalty in the first half, but the attempt was saved by Hartford’s goalkeeper, Jamis Fite (University of Michigan, West Hartford, CT). Hartford City nearly scored immediately thereafter, but the goal was ruled out for offside. Danny Baxter (Baltimore, MD), a member of that legendary 2017 Christos FC side, playing in only his second match of the season, scored in the 48th minute. Baltimore survived a nervy balance of the second half to claim victory.
Despite playing in different conferences, Hartford and Baltimore have some familiarity with one another. As part of its trip to the 2018 national championship, Motown defeated Baltimore 3-0 in an East Region semifinal match. Baltimore were 1-0 victors in the 2019 rematch (before falling to New York Cosmos B in the region final). The next chapter of their playoffs history will be written at 5:00 PM on Sunday.
The first match of the Midwest Region semifinals, between FC Milwaukee Torrent and Cleveland SC, had your correspondent wondering if their was something in the Minneapolis air that was causing abnormal behavior. The game started normally enough with Ian Cerro (Aurora, CO) scoring for Milwaukee in the 21st minute. Before the end of the first half, though, Cleveland’s coach Lewis Dunne was sent off for a tirade that included kicking advertisement signs that lined the touch-line. The dismissal didn’t seem to affect Cleveland as Admir Suljevic (Derventa, Bosnia-Herzegovina), converted a penalty in the 54th minute. Three minutes later Milwaukee’s Samuel Novak, already on a 43rd minute yellow card, received a second one in the 57th for a wild tackle that was completely pointless given that there was absolutely no scoring threat involved at the moment. About 20 minutes later, Santiago Tiburzi committed a foul that resulted in another penalty for Cleveland. In very silly fashion, he flopped in front of the ball that was placed for the penalty and feigned leg cramps. When he finally returned to his feet, he received a second yellow card (and apparently quite angrily departed the pitch), which reduced Milwaukee to nine men. Suljevic, a fixture of Cleveland soccer who was on the 2016 AFC Cleveland side that won the NPSL championship, once again converted the penalty. The match ended without further incident and Cleveland SC is in the region final for a second consecutive season (having defeated Detroit City on penalties in 2019 to win before losing to Miami FC in the national semifinals).
The second match alleviated your correspondent’s concern as it contained none of the weirdness of the front-half of the double-header. Eli Goldman (University of New Hampshire, Minneapolis, MN) opened the scoring for Minneapolis City, the overall top seed of the playoffs, in the 18th minute. The goal would be followed by this superb effort by local prodcut Aidan O’Driscoll in the 39th minute
Nicholas Hutton (Apple Valley, MN), who has been part of the Minneapolis City squad since 2017 added a goal in the 63rd minute, to close out the scoring for his side. With the 3-0 victory over a Carpathia FC that looked tired after travelling from Detroit and playing a match on Wednesday, Minneapolis City have reached the Midwest Region final for the first time in four seasons of NPSL play. The match against Cleveland SC will take place at 2:30 PM EDT.

The one playoff match tonight is the West Region final between Denton Diablos and FC Golden State. Golden State will have traveled approximately 1,400 miles from home for the match.
The winners of the region finals advance to the national semifinals, which will take place on Saturday, July 31. Seeding is based on regular season points per game. The remaining teams are ranked thusly: Minneapolis City-FC Baltimore Christos-Cleveland SC-Denton Diablos-FC Motown-Tulsa Athletic-Southern States-FC Golden State
As such, the Midwest Region champion is assured a home match in the semifinals while the South Region champion is guaranteed to be on the road. Nearly all other details will not be settled until Sunday evening when the result of the East Region final becomes evident.
The next update will be posted tomorrow morning to cover the West Region final.
NPSL Playoffs Update 7/22/21
July 22, 2021
Updated for Gulf Coast Conference and South Region playoffs
While this weekend out to be the point at which the mostly asymmetrical NPSL playoffs finally converge to symmetry, it appears that we will have to wait a bit longer. While the West Region final is set, the East Region semifinals are scheduled (not without controversy!), and the Midwest Region quarterfinals have taken place, the South Region remains unsettled. We will review the matches that have taken place since Friday night to get us to this point as well as note the match that has yet to take place.
South Region
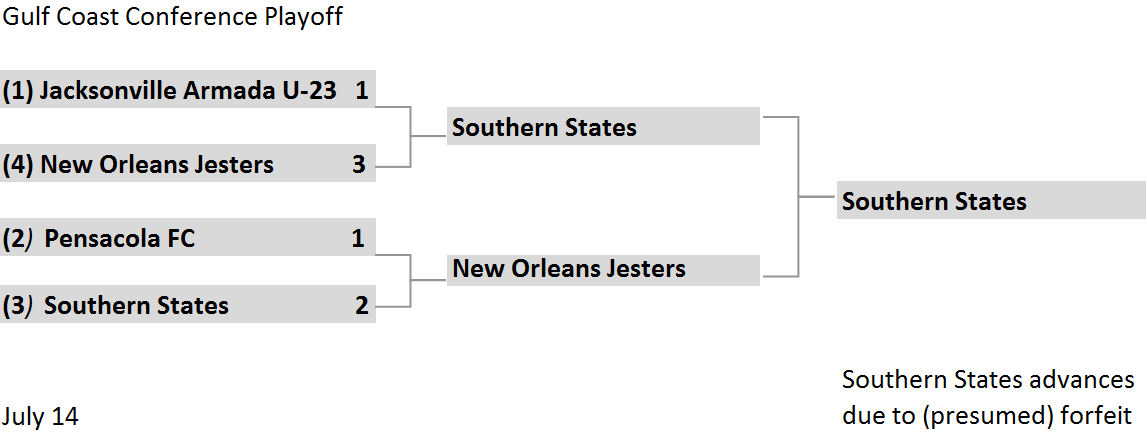
The Gulf Coast Conference championship match that was scheduled for Sautrday July 17 before being postponed due to “several positive COVID-19 tests reported among the New Orleans Jesters players” remains yet to be played or scheduled. On Tuesday, your correspondent noted, with skepticism, that the NPSL website showed the match scheduled for Wednesday night. The skepticism was warranted as the match (which had not been promoted by either club) disappeared from the website the next day. In hopes of receiving news of the status of this match, your correspondent has been holding the publishing window for this update open for so long that an alligator crawled through and is now roaming the premises, which forced the issue. At this time, there is nothing further to report on the matter. Although, as we shall see, a club is selling tickets for a South Region final to be played on Sunday.
UPDATE: As this post was being composed, the NPSL posted the below statement
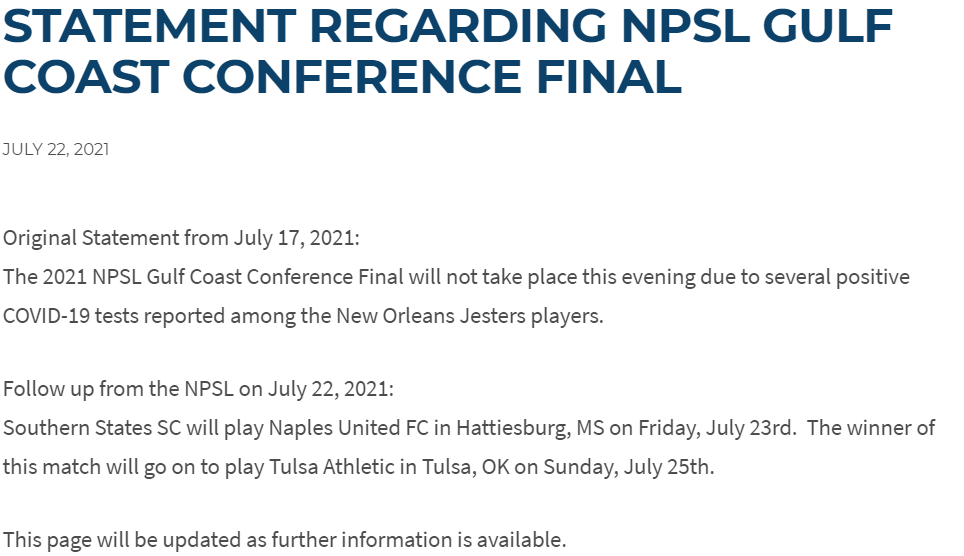
So, Southern States is the Gulf Coast Conference champion. They will host the South Region semifinal match on Friday night.

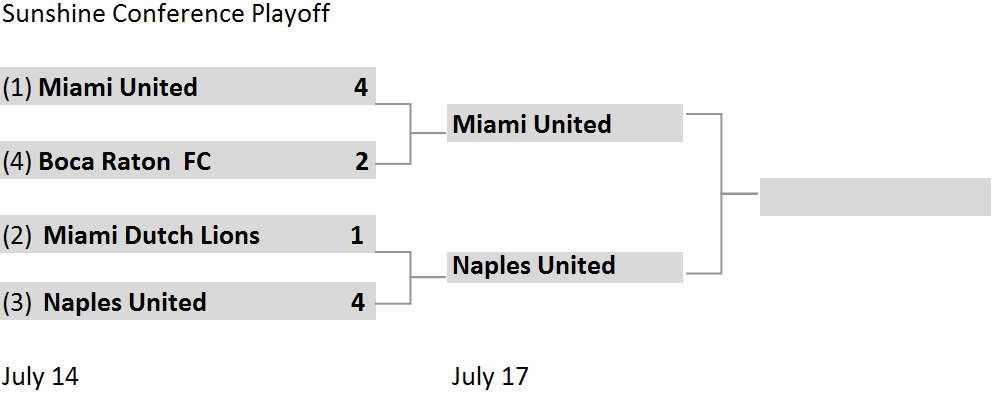
Meanwhile, the other conference championships did take place on Saturday night. In the Sunshine Conference, Naples United upset Miami United to reach win its first conference title in four seasons of play. Long-time Miami United defender Daryl Gordon (Miami, FL) scored for the home team in the 34th minute but that was the only joy they would receive. Argentine Augustin Marisco scored in the 58th and 67th minutes. Fellow countryman Jonathan Gonzalez, who scored two goals in the conference semifinal match, added another in the 82nd minute. Yet another Argentinian, Juan Cano, who played for lower-level clubs in Sicily and Sardinia before coming to Florida, added the final goal for Naples. They will make the trip to Hattiesburg, MS to face Southern States at 7:30 PM (EDT) on Friday night.
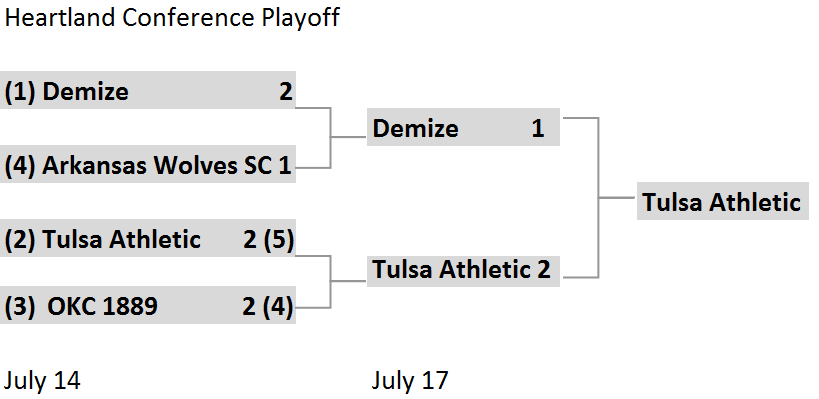
In the Heartland Conference, Tulsa Athletic upset Demize 2-1. Colombian Juan Arias (Oral Roberts University) who is in his second season with Tulsa, scored in the 24th minute. His college teammate, Dante Brigida (Edmond, Oklahoma), added to Tulsa’s tally in the 64th minute. Demize’s lone goal came in the 87th minute via Brazilian Rian Marques (also of Major Arena Soccer League’s Kansas City Comets).
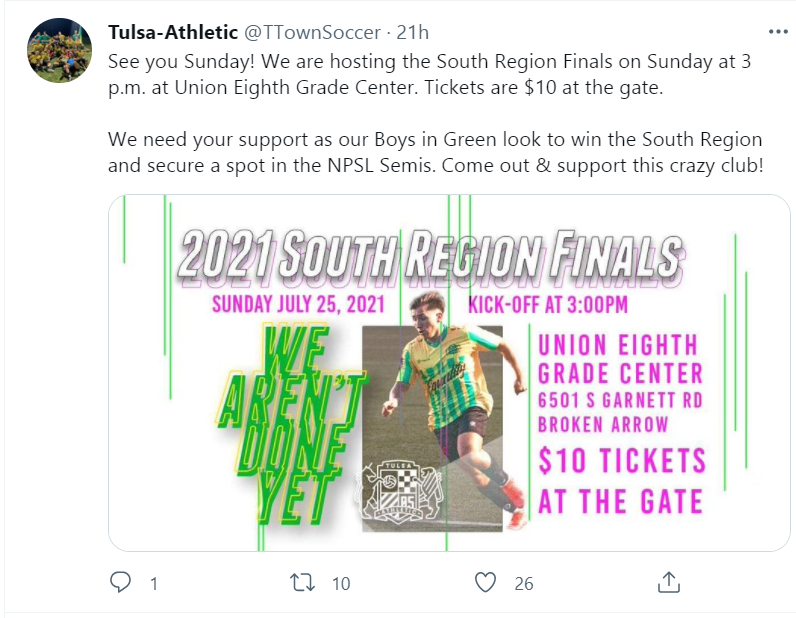
Under posted rules, Tulsa has hosting rights for the South Region final (the reason for this caveat will become soon in a bit). As shown above, Tulsa is selling tickets for a region final match to be held on Sunday. Given that the region semifinal remains to be set and (again, under posted rules), if New Orleans Jesters were to be in the semifinal, they would have to travel to Naples, Florida with the winner then having to travel to Oklahoma, it seems unlikely that this region final match will take place as scheduled. It may be the case, however, that the aforementioned complicating details have been resolved in some fashion and Tulsa has been reassured that they will host a match on Sunday. Given the radio silence from the league and the clubs involved, it is impossible to tell from publically available information. We simply have to wait and see.
Update: It appears that the match will take place as scheduled (perhaps slightly time-delayed for the benefit) of the region semifinal winner.
East Region
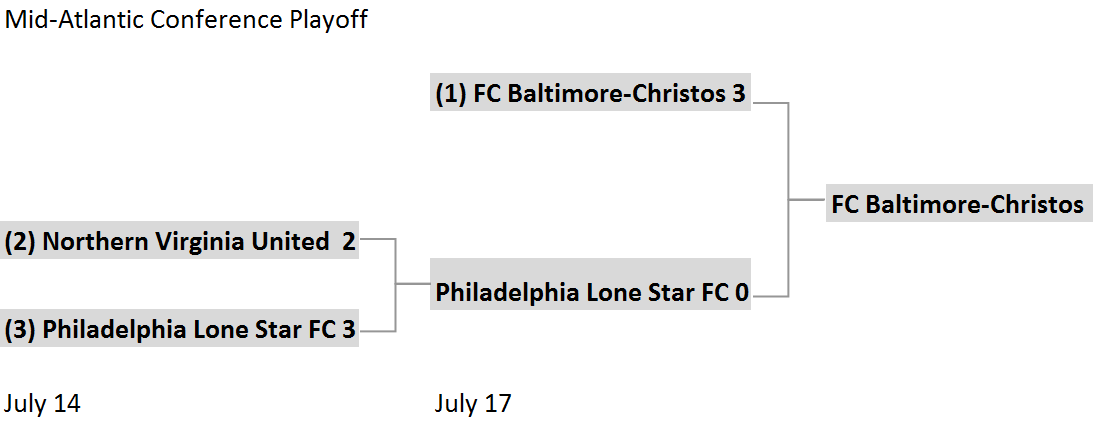
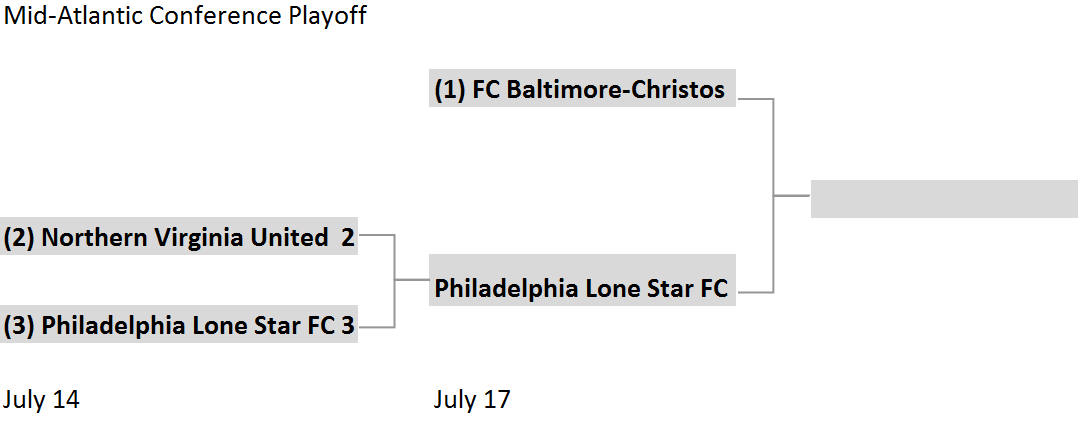
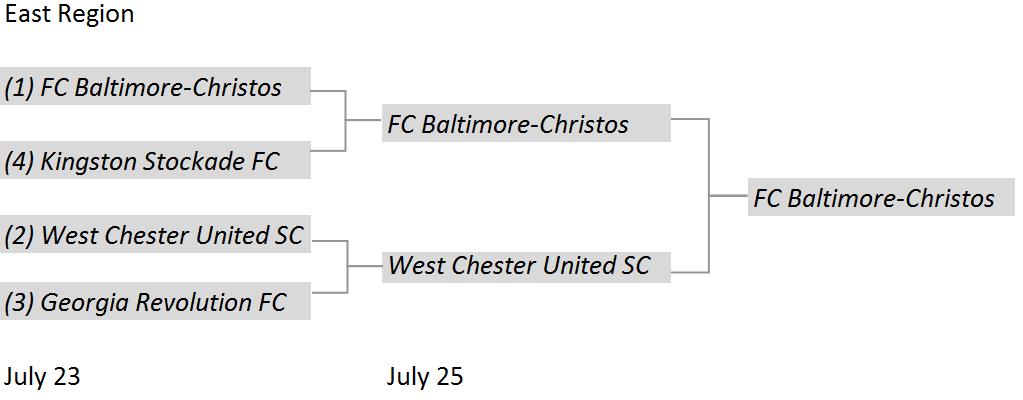
Thankfully, there is no such uncertainty in the East Region. On Saturday night, FC Baltimore-Christos rolled to a 3-0 victory over Philadelphia Lone Star FC. They were beaten by a couple of players familiar with the city of Brotherly Love; Ben Stitz (University of Pennsylvania, Baltimore, MD) and Brady O’Connor (Temple University, Baltimore, MD) scored in the 33rd and 51st minutes respectively. Alex Lee (Rockville, MD), who appeared in 122 matches for then USL Pro Side Richmond Kickers from 2013 to 2018 before joining Christos FC, scored the additional goal in the 89th minute. The victory means that FC Baltimore-Christos is the host for the East Region semifinals and final. More on that shortly.
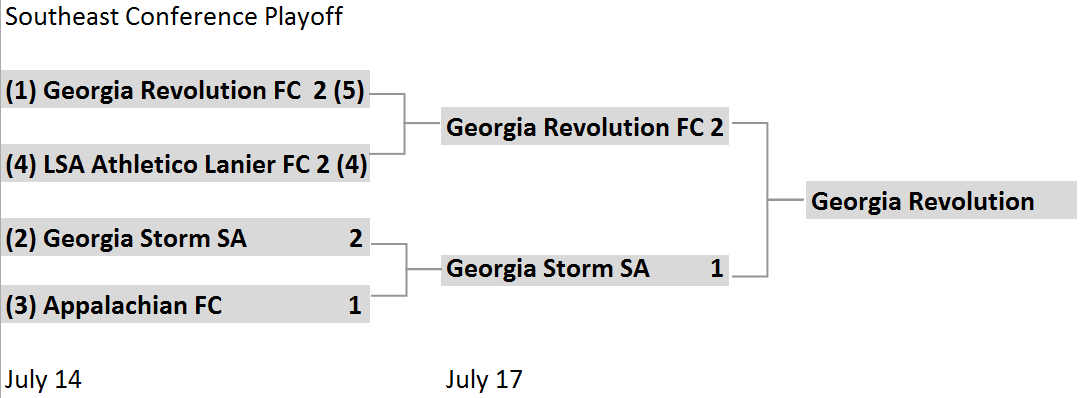
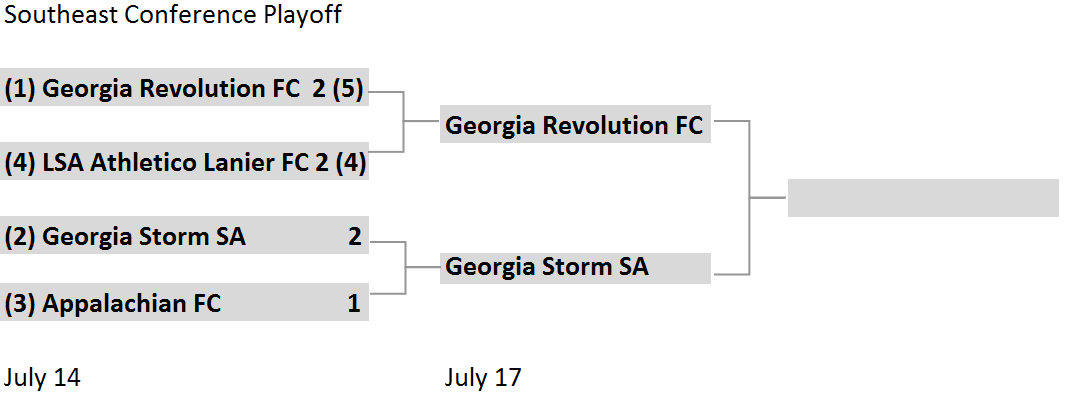
In McDonough, Georgia Revolution defeated Georgia Storm to win the Southeast Conference on Saturday night. The visitors from Carrolton got on the board first with Stephen Bivens (former Revolution player and current General Manager for Storm) scoring in the 27th minute. Gianmaria Fiore (Georgia Gwinnett College, Naples, Italy) scored the equalizing goal in the 62nd minute. Ryan Carmichael (Hofstra University, Armagh, Northern Ireland) scored the game-winner 22 minutes later.
By the rules posted on the NPSL website that your correspondent was using as guidance for his outlook and updates, the win, combined with their superior PPG average, out to have given Georgia a home semifinal match. That is not to be the case, however.
In replies to this tweet, FC Motown and Philadelphia Lone Star contested Revolution’s framing of events and stated that it had been previously agreed that the East Region playoff would rotate among winners of the conferences and that this season the winner of the Mid-Atlantic Conference was going to be the host. The arrangement is sensible given the geographic spread of the teams in the region (the Midwest Region has long held its playoff semifinals and final in a common location). It is quite lamentable that Georgia Revolution was apparently unaware of this arrangement (note that its conference was previously aligned to the South Region and this is the first season it has fallen under the East) and that this arrangement was not detailed on the NPSL website in its playoffs guidelines. Anyhow, Georgia Revolution will be playing in an East Region semifinal match to be held at Baltimore on Friday.
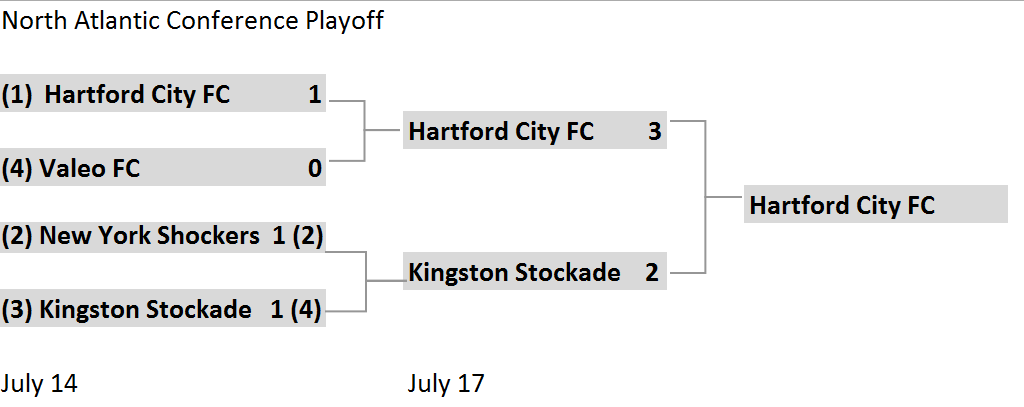
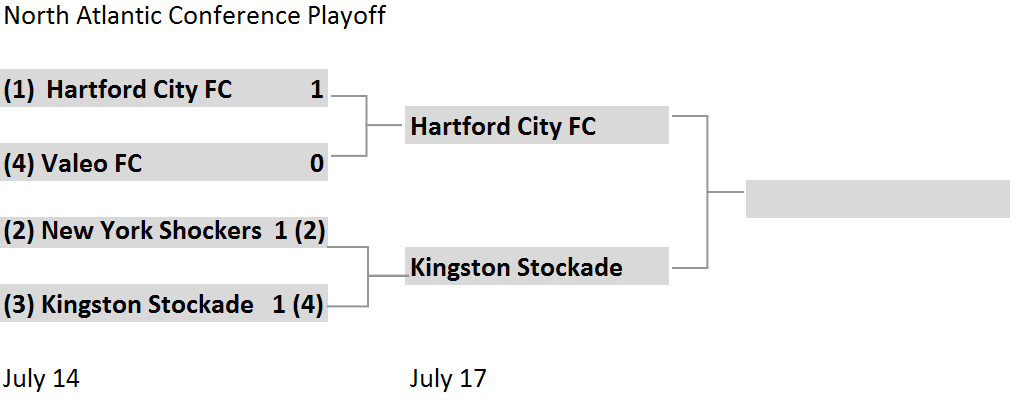
In the North Atlantic Conference, Kingston Stockade equalized twice, but Hartford City took the lead for a third and final time to win the championship match. Cooper Knecht (Fairfield University, Storrs, CT) opened the scoring in the 13th minute. Scott Zobre (Poughkeepsie, NY), who scored Kingston’s lone goal in the conference semifinal match, put the ball in the back of the net in the 24th minute. Noah Silverman (Central Connecticut State University, Berlin, CT), who likewise scored Hartford City’s lone goal in its semifinal match put his team back in the lead six minutes later. Eight minutes after that, Hugo Guerra (University of Rhode Island, Brewster New York) drew Kingston level once again. Knecht scored the game-winner in the 76th minute. Hartford will make the trip to Charm City for a semifinal match on Friday.

On Sunday night, Morristown, New Jersey side FC Motown defeated FC Monmouth. Captain Ryan Peterson (Sydney, Australia) converted a penalty kick in the 37th minute for his second playoff goal of the year. Michael Bellow (England, previously of Atlantic City FC and NISA side New Amsterdam) notched the winning goal one minute later. The win puts FC Motown in the East Region playoff for the fifth consecutive time (having made it as Clarkstown SC Eagles in 2015 and 2016 with subsequent appearances under is current name).

The East Region semifinals will take place on Friday. Georgia Revolution faces FC Motown at 4:00 PM and FC Baltimore-Christos will take on Hartford City FC at 7:00.
Midwest Region

After closing out its regular season on Saturday, the Midwest Region playoff started on Tuesday night. The more dramatic of the two quarterfinal matches occurred between North Conference runner-up Duluth FC and Great Lakes runner-up Carpathia FC. Jake Starling (Florida Southern College, Dade City, FL) put the hosts ahead in the 26th minute. 2021 NPSL Golden Boot winner Sidney Warden (Merceyhurst University, London, England) added a goal for Duluth 12 minutes later. The visitors from Detroit rallied in the second half as Owen Smith (Oakland University, New Plymouth, New Zealand) scored goals in the 79th and 82nd minutes. The match then went to penalties and each side converted their first four attempts. Finn Jurak (Oakland University, Canberra, Australia) saved Duluth’s fifth attempt and Alex Serwatka (Oakland University, Troy, MI) converted his attempt to advance Carpathia to the region semifinals.
Cleveland SC had been poised to have a bye to the region semifinal. However, a scoreless draw at Erie Commodores on Saturday left it ranked third among conference champions in Points Per Game. Because of that, they had to play a Tuesday night quarterfinal match against fellow Rust Belt Conference side Pittsburgh Hotspurs. Vinny Bell (Parma Height, OH, member of 2016 NPSL champions AFC Cleveland) opened the scoring. Alec Nagucki (Medina, OH) added to the lead in the 27th minute. Tom Beck (Poland, OH) joined the fun in the 54th minute and Smith Pepper (Capetown, South Africa) tallied the final goal.
Minneapolis City SC, who finished the regular season with the best PPG average and therefore have the potential to host national semifinal and championship matches, will face Carpathia FC at home at 8:00 PM (EDT) Friday night. Great Lakes Conference champions FC Milwaukee Torrent takes on Cleveland at 5:00 PM in the front half of the doubleheader in Minneapolis at 5:00.
West Region
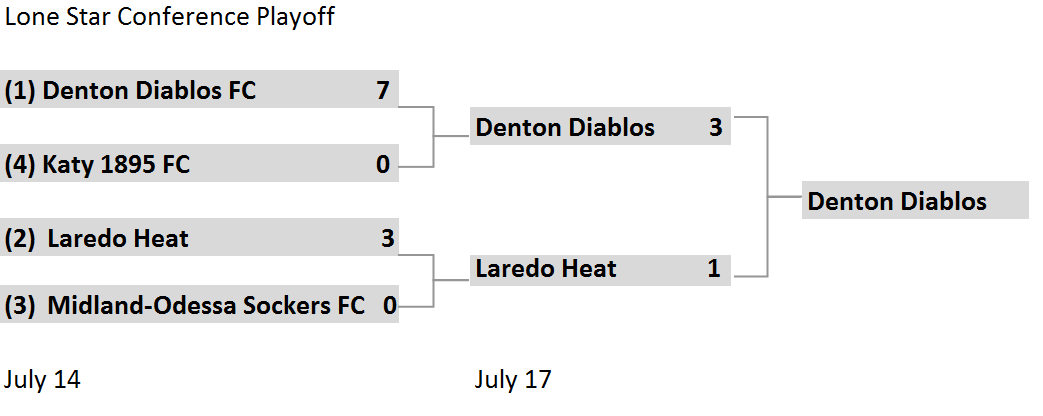
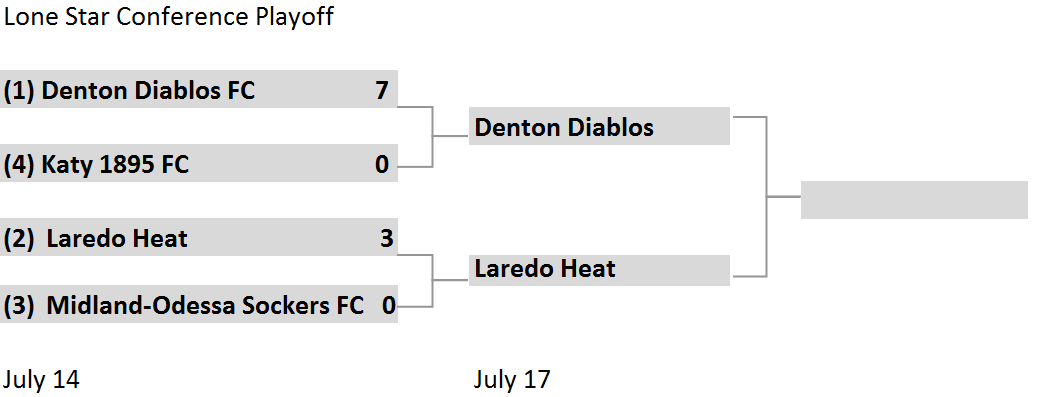
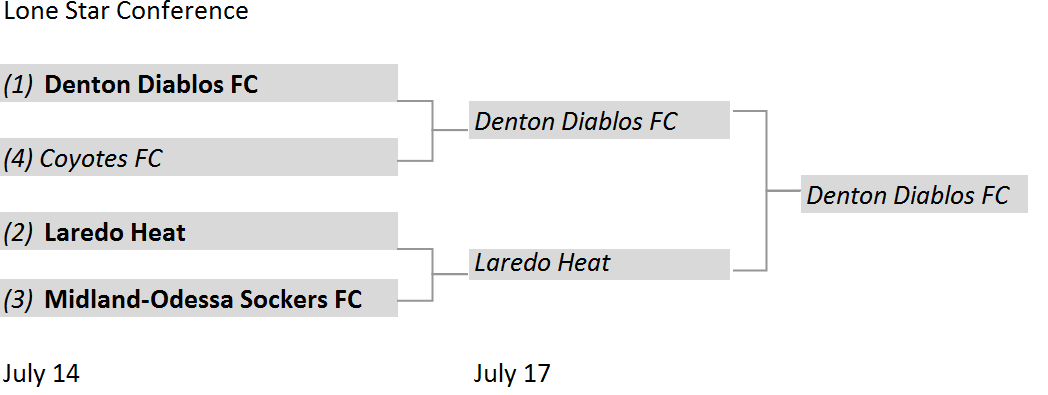
Denton Diablos defeated Laredo Heat on Saturday night to advance to the West Region final. Trevor Amann (Midwestern State University, Westminster, CO), who had a brace in the conference semifinals, earned a second one as he scored in the the 45th and second half stoppage time. James Doyle (Merseyside, England) opened the scoring for Denton in the 9th minute. Nadav Datner (Hartford University, Ya’ad, Israel) scored Laredo’s lone goal in the 75th minute.
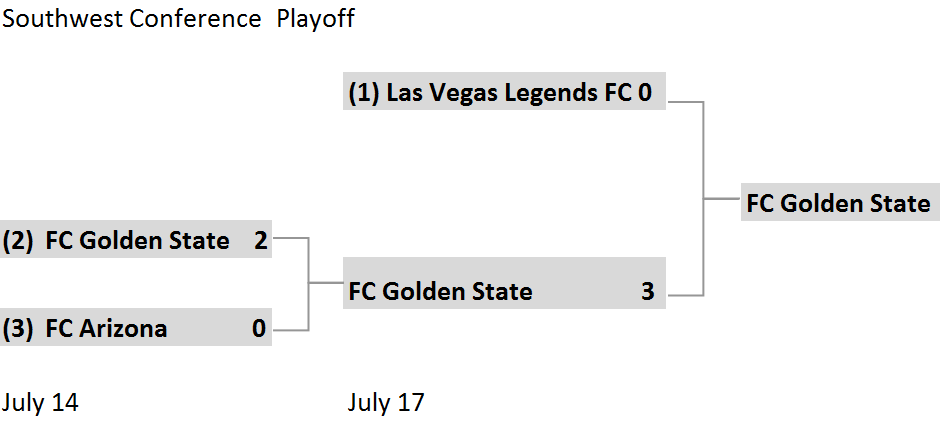
FC Golden State claimed the Southwest Conference title on Saturday night. Eduardo Faria (Porto Alegre, Brazil) scored in the seventh and eleventh minutes. Christian Gordillo (Mexico City, MX) scored his second goal of the playoffs in the 37th minute.
The Los Angeles County side will travel to Denton for the West Region final to be played at 8:30 PM (EDT) on Saturday. Typically, the region playoff has more matches, but COVID related restrictions forced many west coast clubs to sit out the NPSL regular season.( Eight members of the Golden Gate Conference are participating in a “Return to Play” series that is independent of the season and the playoffs).
The winners of the region finals advance to the national semifinals. The top two teams on the basis of PPG get to host the matches. This is how the remaining teams are ranked by PPG
South Region – Tulsa Athletic (8), Southern States (10), Naples United (13)
East Region – FC Baltimore-Christos (3), Georgia Revolution (5*), FC Motown (7), Hartford City (11)
Midwest Region – Minneapolis City SC (1), FC Milwaukee Torrent (2), Cleveland SC (4), Carpathia FC (9)
West Region – Denton Diablos (6), FC Golden State (12)
*Georgia Revolution and Denton Diablos are level on PPG. *By one goal* Georgia Revolution gets the tiebreaker on the basis of goal differential.
As such, absent Carpathia FC stealing the show, the road to the league championship match will run through a Midewest region side. Naples United and FC Golden State are the only clubs guaranteed to be on the road if they were to advance to the national semifinals. Those matches are scheduled for Saturday, July 31. The national final will be held on Saturday August 7 at the home field of the higher ranked club.
The next update will be posted after the various region semifinal matches on Friday night. This post will be updated when the situation regarding the Gulf Coast Conference championship is resolved.
NPSL Playoffs Update 7/17/21
July 17, 2021
(Updated for South Region/Gulf Coast Conference)
We saw more upsets in the playoffs last night as the Keystone Conference was turned upside down. We will review those before proceeding to take a look at the conference championships that will be contested tonight.
East Region
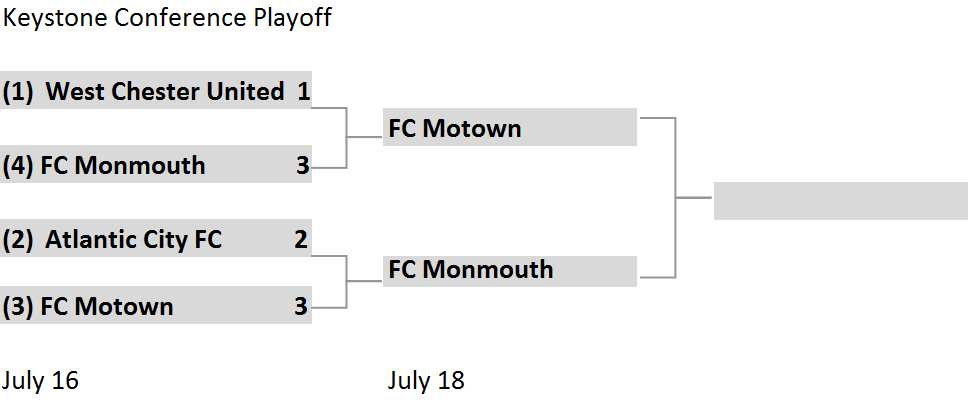
The top club in the East Region (on the basis of regular season Points Per Game), West Chester United were defeated by FC Monmouth. In the 60th minute, Walter Calderon opened the scoring for Monmouth. Calderon is from El Salvador and has experience with a number of teams including New York Red Bulls U-18 (2015), FC Motown (2018, the season they went to the championship), Atlantic City FC (2019), and most recently Jackson Lions of the Garden State Soccer League Super Division). He added another goal 60 minute. He scored again for the hat trick in stoppage time. West Chester converted a penalty kick after that, but there was no time left to start a rally and FC Monmouth achieved the upset.
They will face Morristown, New Jersey’s FC Motown in the conference final. German Niklas Laenger (Central Court University) scored for Atlantic City in the sixth minute. Bermudan-born defender Marcus Hackett answered for Motown in the 23rd minute. Ghanian Roy Boteng, who has played for USL PDL sides Portland Timbers U23s and San Francisco Glens before joining USL Championship side New York Red Bulls II prior to joining Motown this season, scored five minutes later. Club captain, Australian Ryan Peterson who had been in the youth system of A-League side Central Coast Mariners, added another goal five minutes after that. Atlantic City did not have a response until the 90th minute when Jacob Campbell put the ball into the back of the net. That would be all for the hosts, though, and FC Motown is back in the Keystone Conference final for the third consecutive season.
Motown and Monmouth will face each other at 7:00 PM on Sunday at Montclair State University. The winner of that match will advance to face one of the winners of the other conference championships in the region.
FC Baltimore-Christos faces Philadelphia Lone Star in Essex, Maryland at 7:00 PM. The clubs have met each other twice this season. Baltimore won at home 5-1 on June 16 and the two drew at one all in Philadelphia last Saturday.
In McDonough, Georgia, Revolution and Storm have a third meeting at 8:00 PM. Georgia Revolution won 1-0 on its May 1 road trip. The match in McDonough ended in a 1-1 draw on June 5.

Hartford City hosts Kingston Stockade at 7:30 PM. Kingston defended its home turf with a 3-0 victory on May 15 while the June 12 match in Hartford ended in a 1-1 draw.
The East Region semifinals will be held on July 23 with the seeding based on regular season PPG (#1 vs #4, #2 vs #3). The eight teams are ranked thusly: FC Baltimore-Christos, Georgia Revolution, FC Motown, Hartford City, Kingston Stockade, Georgia Storm, FC Monmouth, and Philadelphia Lone Star. As such, Baltimore and Revolution are guaranteed home matches if they win while Monmouth and Philadelphia would go on the road, regardless of other results
South Region

At 8:30 PM in Oak Grove, Mississippi, Southern States faces New Orleans Jesters for the Gulf Coast Conference title. At home, Southern States won 2-1 on May 12. The clubs played to a 1-1 draw in New Orleans on June 26.
UPDATE: At ~3:48 PM the NPSL reported
Given the tight schedule and travel requirements, one would presume that Southern Stars would be declared the champion. That is yet to be announced, however.
The Sunshine Conference final will be played at 7:00 PM in Miami Gardens, Florida. Naples was victorious at home 3-1 on May 16. Miami won the return fixture 2-0 on June 19.
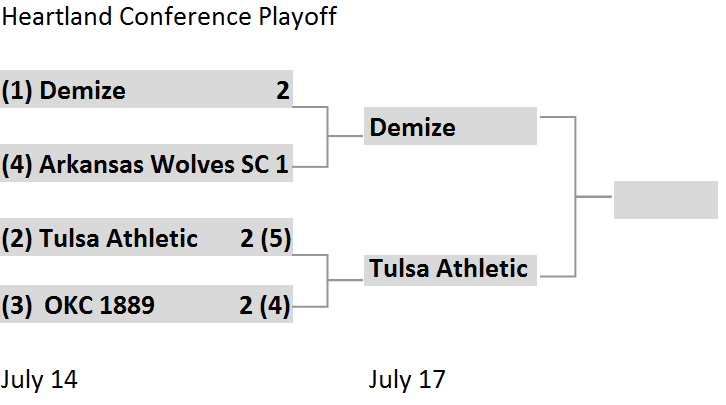
Demize and Tulsa Athletic meet at 8:00 PM (EDT) in Springfield, Missouri to decide the Heartland Conference title. Both previous meetings ended in draws; 1-1 at Demize on June 1 and 2-2 at Tulsa on June 20.
The South Region semifinal will be held on Friday July 23. The top seeded team on the basis of PPG gets a bye to the July 23 Region Final. The PPG rankings of the remaining teams in the region are as such: Demize, Miami United, Tulsa Athletic, Southern States, Naples United, New Orleans Jesters. Because of that order, we know that the Gulf Coast Conference Champion will have to play in the semifinal and Demize gets the bye if it is victorious.
West Region
In Denton Texas, Diablos take on Laredo Heat at 8:30 PM. The clubs’ only meeting came occurred in Laredo on June 3 and resulted in a 3-0 victory for Laredo.
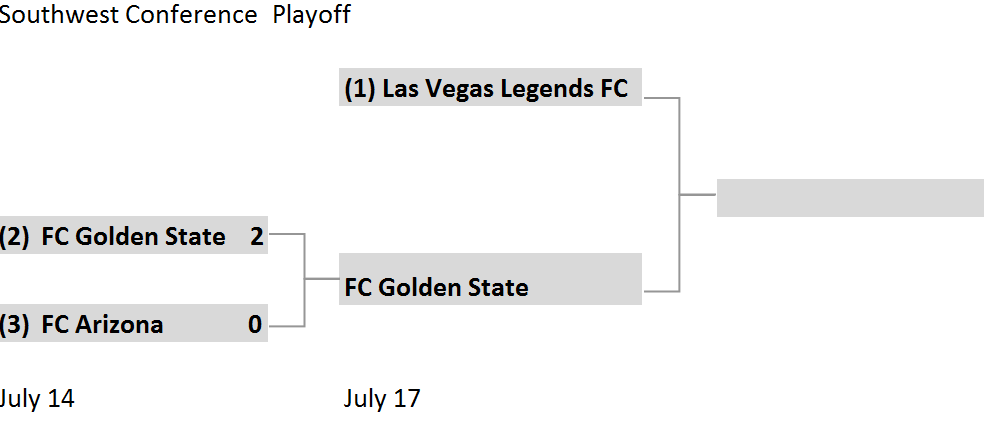
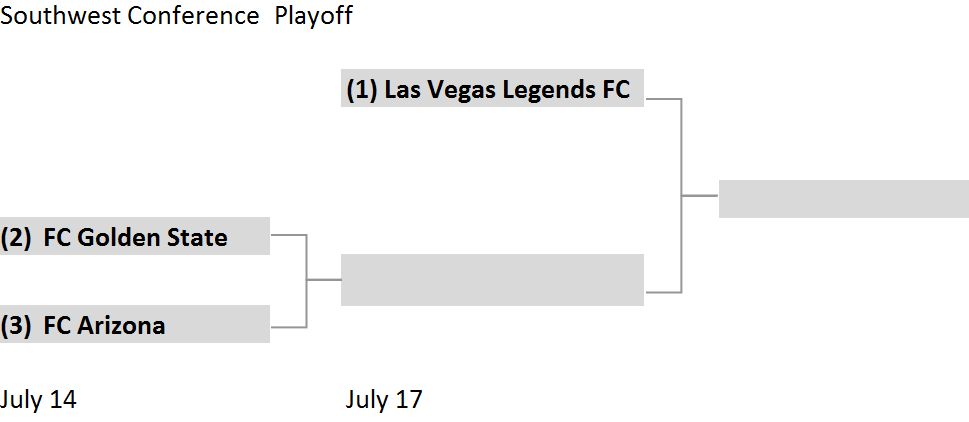
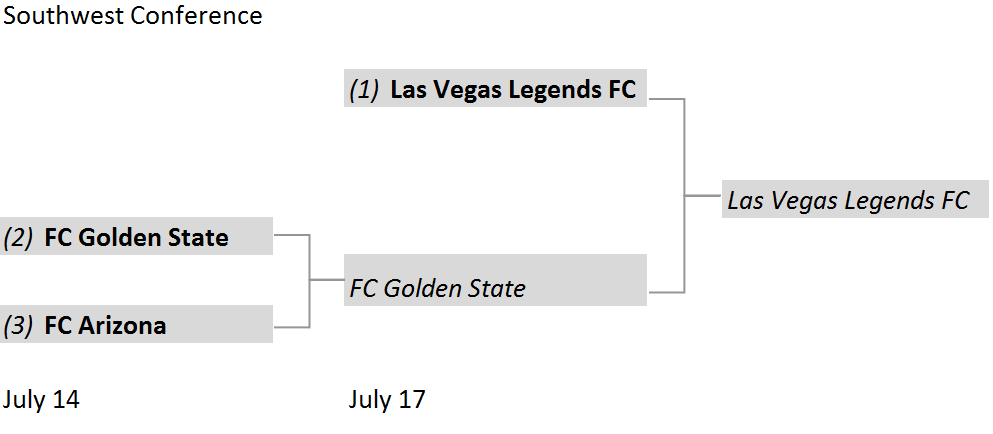
Finally, Las Vegas Legends duel FC Golden State at 10:30 PM. Golden State won its home match 5-1 on May 25 while Las Vegas claimed the return fixture 4-3 on June 12.
The winners of these two conference finals will face each other in the region final on Saturday, July 24 with the higher-seeded team being the hosts. PPG rankings are as follows: Denton Diablos, Laredo Heat, Las Vegas Legends, FC Golden State. Because of that, we know that the Lone Star Conference Champion will be hosting the Southwest Conference champion.
Midwest Region
Last night, Duluth FC defeated Sioux Falls Thunder 5-2 to claim the last berth in the region playoff. They will play in a region quarterfinal on July 20. Their opponent is likely to be FC Milwaukee Torrent. However, if Cleveland SC were to lose tonight at Erie Commodores, then Milwaukee would have a bye and Duluth would host Carpathia . Pittsburgh Hotspurs will play in a quarterfinal on July 20 (either vs Carpathia or at Cleveland). FC. Minneapolis City has locked in a bye to the July 23 semifinals. The semifinals and July 25 final are held at a common location that are yet to be determined.
Tomorrow’s post will have the Midwest Region bracket as well as recaps of the conference finals that are taking place tonight.
NPSL Playoffs Update 7/16/21
July 16, 2021
With five upsets and three matches going to penalty kicks, there was a sane amount of drama in the NPSL playoffs on Wednesday night.
South Region
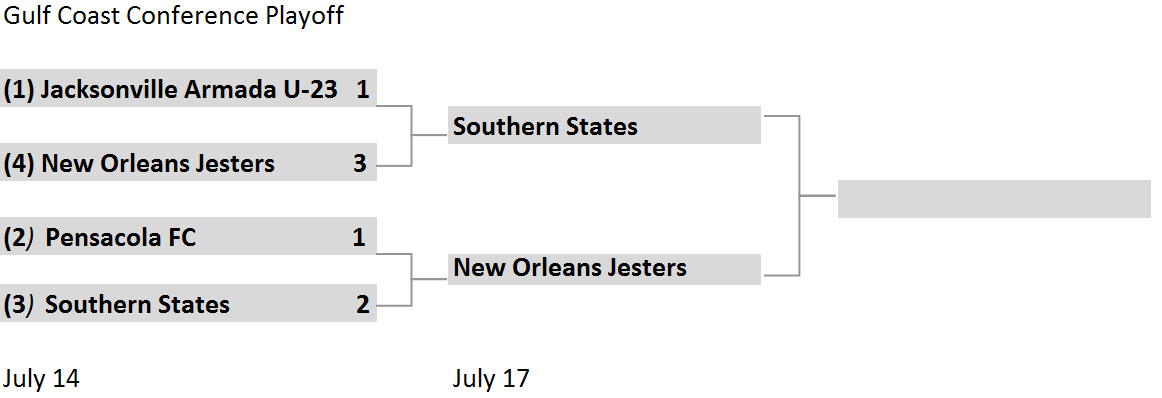
To your correspondent’s dismay, the Gulf Coast Conference was the place for surprises. The home teams, both of which defeated their visitors twice in the regular season, both lost. In Jacksonville, Sheldon Green, who arrived in the Big Easy from English National League North side AFC Fylde, put New Orleans on the scoreboard in the fourth minute. Jacksonville area native Reed Davis equalized for the home team in the twelfth minute. Four minutes later, Green again ran wild down the right side and put a ball across to long-time Jesters forward Mason Wash that subsequently ended up in the net. Jacksonville put forth a number of corner kicks and crosses into the attacking box in the second half, to no avail. An own goal scored off a ball errantly headed by a Jacksonville defender gave New Orleans security in the 76th minute and would-be national semifinalist Jacksonville found itself out of the playoffs.
The night would prove similarly joyless for the playoff hosts out west on Interstate 10. Tom Shepherd, who is from Stoke-On-Trent, England, provided a quick goal for Southern States. Jamaican born Jabari Hylton, who spent his youth in England before returning home and playing three seasons with University of the West Indies Football Club, equalized for Pensacola in the 11th minute. Oxford, England born defender Danny Reynolds, who had failed to convert a penalty in the May 30 meeting between these two clubs, put Southern States back in the lead in the 42nd minute. The Hattiesburg, Mississippi side held on for the victory and will host New Orleans in the conference championship on Saturday.

Boca Raton took an early lead against Miami United with a goal scored by Pedro Veiga. Argentine Nicolas Micoli equalized in the 30th minute and Matias Solari converted a penalty four minute later to put United ahead. Paulo Reichardt extended Miami’s lead ten minute later. Sinisa Sprecakovic (from Mannheim, Germany and a player for local Lynn University) answered for Boca Raton early in the second half, but Solari scored again to put Miami United in the conference championship.
Their neighbors were not so fortunate. Miami Dutch Lions found itself down 0-3 before putting a goal on the board in the 85th minute via Presten Manthey. Naples United established its lead with goals by Jonathan Gonzalez (11′, 53′) and Lucas Espindola (28′). Pablo Marisi put the icing on the cake with a goal in the 88th minute. Naples will travel to Miami on Saturday in a rematch of a 2019 conference semifinal in which Miami United was victorious.
Things went to form in the Heartland Conference, thought it was a close-run thing. In Springfield Missouri, Quentin Hormung from Geneva, Switzerland, playing in his second season with Demize, scored the opening goal in the sixth minute. Zambian-born winger Salifyaji Mugala answered for Arkansas three minutes later. Brazilian forward Rian Marques, who also plays for Major Arena Soccer League side Kansas City Comets gave Demize the decisive goal in the 72nd minute.
The most dramatic game of the evening occurred in Tulsa. Joe Garcia, in his fourth campaign with Tulsa Athletic converted a penalty in the 40th minute. Callum Shepherd, who came to Oklahoma from Liverpool, England, equalized for OKC in the 62nd minute and they took the lead two minutes later thanks to a goal scored by Jason Hogan.. In the final minute of stoppage time, Jamie Gilbert, with OKC for a fourth season, scored via a header to force extra time. With no goals scored in extra time, the match went to penalties. Bryson Reed, a three season veteran of Tulsa saved OKC’s second attempt. All other penalties were converted, which gave Tulsa the victory. They will travel to Demize on Saturday for the conference championship.
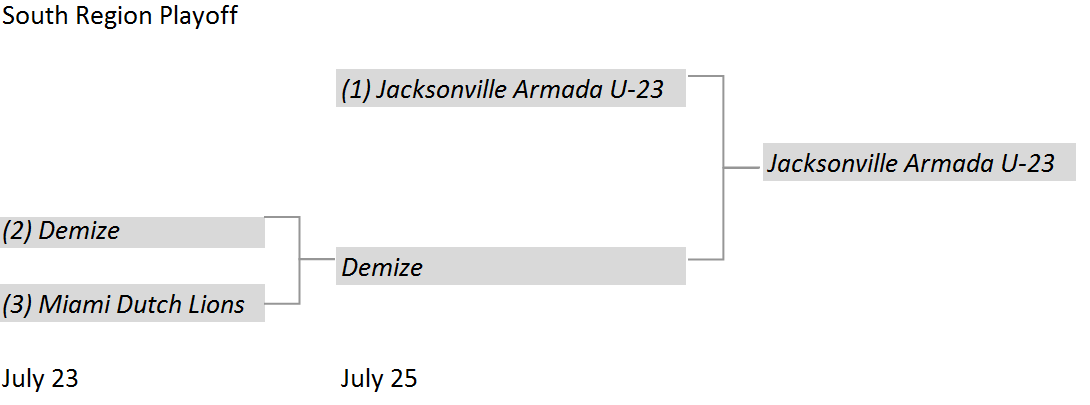
The upset of Jacksonville Armada U-23 means that Demize has now the inside line to the South Region final as winning the conference final and having the best regular season PPG of the other conference champions will give it a bye. If Demize loses and Miami United wins, United gets the bye. Otherwise, Tulsa Athletic gets to automatically advance to the region final, if it upsets Demize.
East Region
Northern Virginia United had a 2-0 lead in its Mid-Atlantic Conference semifinal match versus Philadelphia Lone Star. Arlington, Virginia native Carter Humm scored in the fourth minute and fellow area native Jack Rawlins added a goal 20 minutes later. Liberian-born, Philadelphia raised forward Anthony Allison provided Lone Star’s immediate response. Patrick Singbah, who has previously played for Liberian side Nimba United FC and NPSL side FC Columbus, provided the equalizer in first-half stoppage time. Anthony Allison’s second goal was the winner, scored in the 73rd minute. Northern Virginia will face FC Baltimore-Christos in the conference championship on Saturday.
In McDonough, top-seed Georgia Revolution survived a strong challenge from LSA Athletico Lanier. Dylan Gaither from Augusta, who previously played for Atlanta United 2 in the USL Championship, scored the opening goal for Revolution in the third minute. Mercer University teammate and McDonough native Ousman Jabang scored the second goal in the 49th minute. Lanier did not get on the scoreboard until the 82nd minute, which is when Juan Munoz-Monsalve scored. Kahlil Bell, previously of USL League Two side Birmingham Hammers provided the equalizer. A scoreless extra time gave way to penalties. Ontario, Canada native Chris Banfi saved Lanier’s seventh attempt, which set up Colchester, England native Oliver Peters’ match-winning conversion.
In Carrollton, Georgia Storm defeated Boone, North Carolina based Appalachian FC. Powder Springs, Georgia native Andrew Carleton, who has experience with Atlanta United, Atlanta United 2, Charleston Battery, and Indy Eleven, scored for Storm in the third minute. Brazilian Angelo Fabricio equalized for Appalachian in the 16th minute. Forward Wilfried Kamdem Tchoupa, who hails from, Yaounde, Cameroon, scored the match winner. Revolution will host Storm in the all-Georgia conference final on Saturday.
In Hartford, Berlin, Connecticut native Noah Silverman scored the lone goal of Hartford City’s match versus Valeo FC in the 26th minute. There was more drama, though, in Albany, New York. Scott Zobre (Poughkeepsie, NY) scored for visiting Kingston Stockade in the 39th minute. Kevin Winglosky (Schodack, NY) provided the tying goal in the 62nd minute. Kingston were reduced to 10 men as Paterson Kadore (Ouagadougou, Burkina Faso) received a red card for violent conduct in the 71st minute. The match would go on to penalty kicks. The second attempts of both squads were both saved. New York’s fifth attempt went over the bar and Paul Makaj (Lagrangeville, NY) converted the winning penalty for Kingston. They will travel to Hartford for the conference championship on Saturday.
West Region
There was comparatively little excitement to be offered in the Lone Star Conference. Denton scored four goals in 24 minutes and added another two before the end of the first half. Trevor Amman (Westminster, CO) opened the scoring and notched a brace. Sam Coad (Highland Village, TX) scored a hat trick. Ricardo Becerra (Southlake, TX) scored the seventh and final goal of the match.
In Laredo, Riccardo Turcis (Turin, Italy) scored in the 27th and 64th minute. Laredo native Elias Periales scored in second half stoppage time. Laredo will face Denton in the conference championship on Saturday.
Finally, in Irvine, California, FC Golden State came out on top versus FC Arizona in the Southwest Conference semifinal. Carlos Anguiano (Los Angeles) scored in the 13th minute and his goal immediately followed by that of Christian Gordillo (Mexico City, MX). Golden State will travel to Las Vegas for the conference championship on Saturday.
As mentioned in the previous update, from the East Region, the Keystone Conference’s semifinal matches are tonight:
West Chester United vs FC Monmouth (7:30 PM): The Pennsylvania club won the sole meeting between the two clubs; 2-0 on June 26. Last year, it lost to FC Motown in the conference semifinal and lost to the same club in the 2018 conference final. Monmouth missed the 2019 playoffs; the New Jersey club’s only playoff appearance came in its 2018 debut season where it lost to Motown in the conference semifinal.
Atlantic City FC vs FC Motown (7:00 PM): The clubs drew 2-2 on May 15 while Atlantic City beat the Morristown, New Jersey club 3-0 on June 5. Atlantic City made the playoffs in its second season (2019) but fell to Philadelphia Lone Star in the conference semifinals. In 2019, Motown reached the Northeast Region semifinal where it fell to FC Baltimore-Christos. In 2018 the club reached the league championship match where it was defeated by Miami FC.
Also, the final regular season matches of the Midwest Region’s North Conference are tonight. At 7:45 PM EDT, Med City faces Minneapolis City SC and at 8:00 PM, Duluth takes on Sioux Falls Thunder FC. As Duluth holds the head-to-head tiebreaker, Med City must post the better result to get the second playoff berth for the conference. Otherwise, Duluth will claim it.
The next update will be posted on Saturday morning to provide recaps of tonight’s matches as well as previews of the various conference finals that will take place on Saturday night.
NPSL Playoffs Update 7/14/21
July 14, 2021
After a relatively drama-free final weekend of regular season in most conferences, of the NPSL it is time for the playoffs to begin in said conferences. A total of 40 teams will participate in the league playoffs in which 38 matches will be played before the championship match on August 7. Let’s dive right into the brackets.
South Region
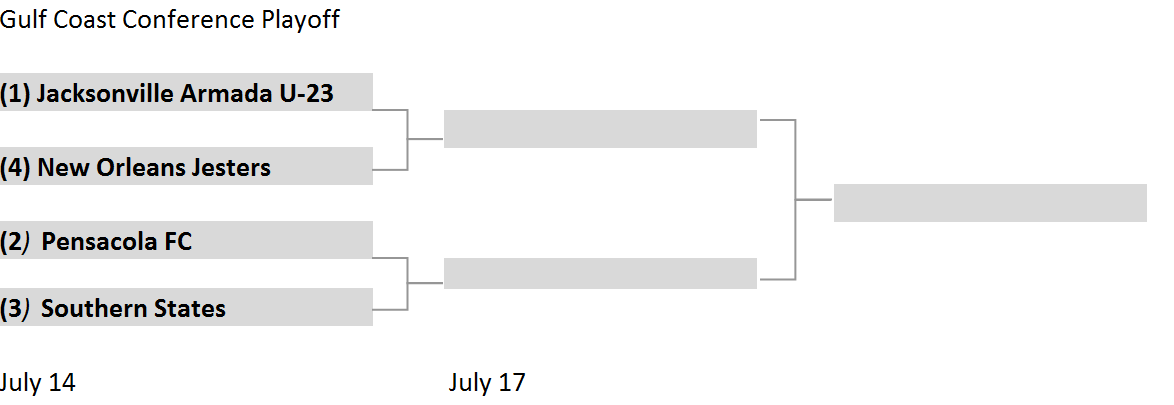
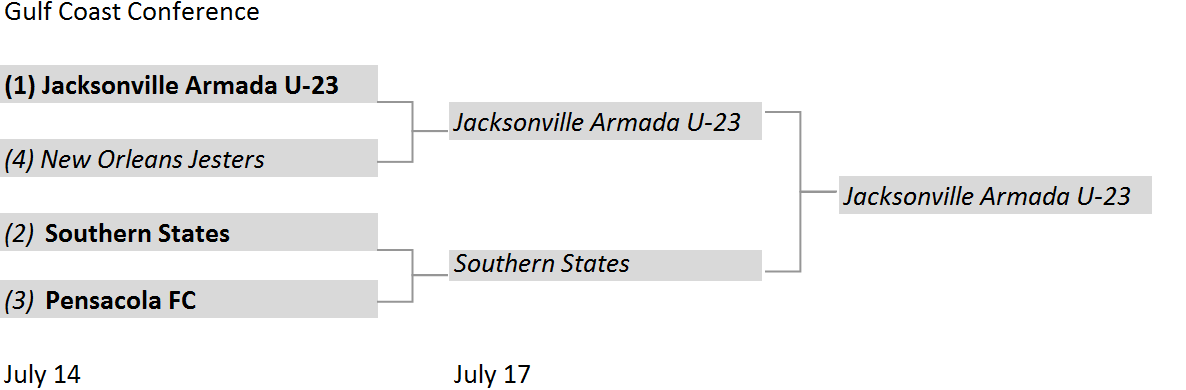
Jacksonville Armada U-23 vs New Orleans Jesters: Jacksonville has won both meetings this season (1-3 on May 29 and 3-2 on June 30). The hosts played in the 2019 Sunshine Conference semifinals; its fore-runner Jacksonville United won the league in 2011. New Orleans was on hiatus in 2019 and was in the Southeastern Conference quarterfinals; the furthest it has gone in the playoffs was the Southeast Conference final in 2014 and 2017.
Pensacola FC vs Southern States: After losing to Jacksonville 3-1 on June 26, Pensacola won its last five matches to overtake Southern States for the two seed. They are the only club in the conference to sweep the Hattiesburg, MS club (1-0 May 29 and 0-2 on June 23). Partly due to having a later start than the other clubs and partly due to postponements, Pensacola has had the busiest July with four matches already played this month. This is Pensacola’s first appearance in the NPSL playoffs as it did not make the playoffs (as Gulf Coast Texans) in its only other NPSL season, 2013. 2021 marked the first season of NPSL play for Southern States.

Miami United vs Boca Raton FC: Miami United swept the series (1-0 on May 20, 2-4 on June 22). The hosts reached the Sunshine Conference final in 2019. Their deepest playoff run was in 2016 when they lost to Chatanooga FC via penalties in the 2016 South Region final. This is Boca Raton’s first appearance in the league playoffs after having failed to qualify in 2017 and 2018 before playing in the UPSL in 2019.
Miami Dutch Lions vs Naples United: The two played to a 3-3 draw on June 6 and Naples won 0-3 on June 23. This is the hosts debut as Miami; as Houston Dutch Lions the club was in the playoffs in each of the seasons from 2016 to 2018 with a 2016 South Region semifinal (loss to Chattanooga FC) being its deepest run. Naples United was in the 2019 Sunshine Conference semifinals (where they lost to Miami United), which was its playoffs debut after having failed to qualify in its two previous seasons of NPSL play.
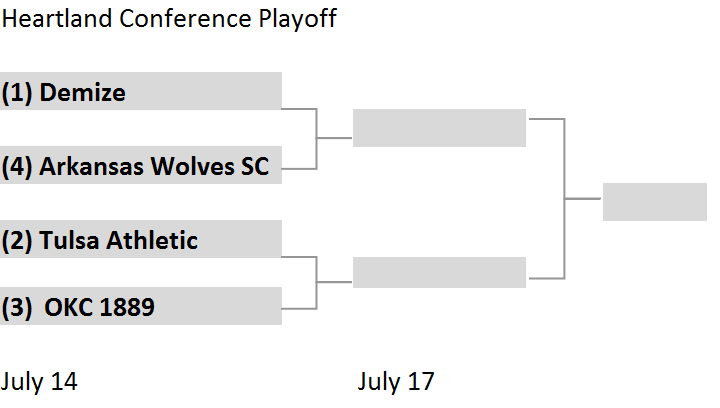
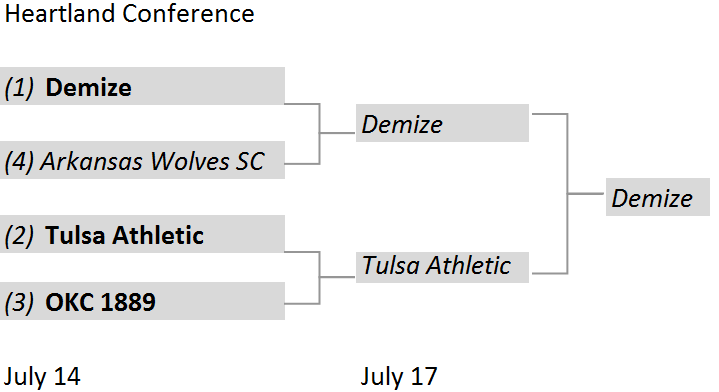
Demize vs Arkansas Wolves SC: Demize was victorious in the two previous fixtures: 4-1 on May and 2-3 on June 23. After five seasons of missing out; the Springfield, Missouri club reached the playoffs in 2019 (lost to Tulsa Athletic in the Conference Final). Their opponents in this match are from Little Rock and in their first season of NPSL play.
Tulsa Athletic vs OKC 1889: This series favored the visitors as OKC won 1-3 on May 16 while Tulsa was on top 0-2 on June 26. Tulsa reached the South Region final in 2019 where it was defeated by eventual champion Miami FC (it also reached the region final in 2014 before losing to Chatanooga FC). This is OKC’s first season in the NPSL.
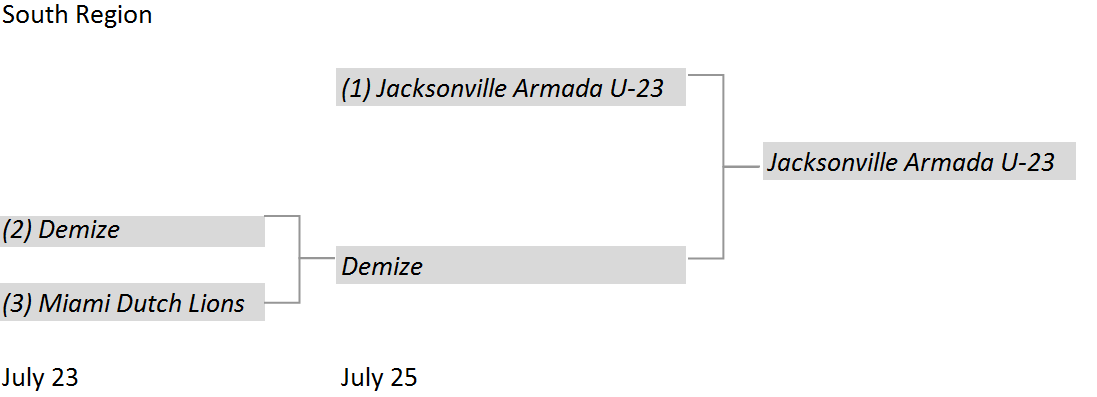
The conference champion with the best regular season points per game (PPG) average advances to the South Region final. The remaining two conference champions play each other with the winner advancing to the final. The clubs in the playoffs are ranked as follows (NPSL ranking) :
Jacksonville Armada FC U-23 (7) – Demize (10) – Miami United (14) – Tulsa Athletic (17) – Pensacola FC (18) – Southern States (19) – Miami Dutch Lions (23) – Naples United (27) – OKC 1889 (29) – New Orleans Jesters (35) – Boca Raton (37) – Arkansas Wolves (44)
As such, if the favorites were to win in each of the conference playoff matches the South Region playoff would take the following form
East Region
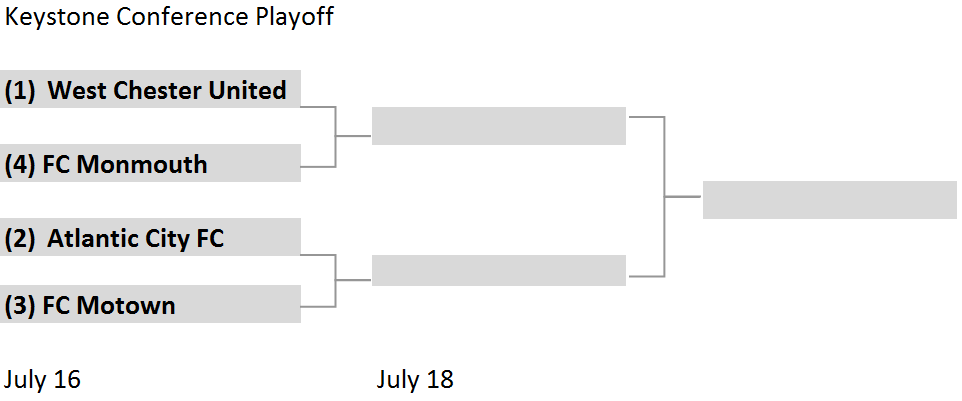
West Chester United vs FC Monmouth: The Pennsylvania club won the sole meeting between the two clubs; 2-0 on June 26. Last year it lost to FC Motown in the conference semifinal and lost to the same club in the 2018 conference final. Monmouth missed the 2019 playoffs; the New Jersey club’s only playoff appearance came in its 2018 debut season where it lost to Motown in the conference semifinal.
Atlantic City FC vs FC Motown: The clubs drew 2-2 on May 15 while Atlantic City beat the Morristown, New Jersey Club 3-0 on June 5. Atlantic City made the playoffs in its second season (2019) but fell to Philadelphia Lone Star in the conference semifinals. In 2019, Motown reached the Northeast Region semifinal where it fell to FC Baltimore-Christos. In 2018 the club reached the championship match where it was defeated by Miami FC.
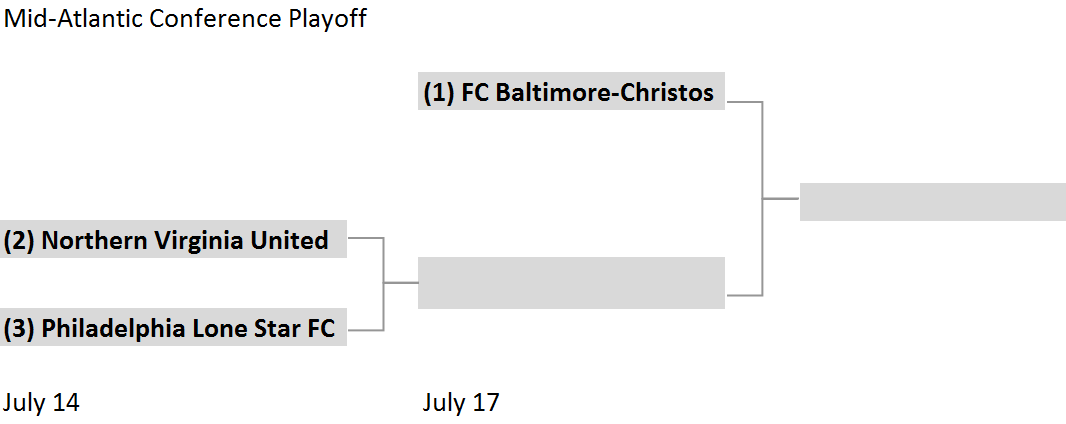
Northern Virginia United vs Philadelphia Lone Star FC: Northern Virginia were victorious in both matches; 1-2 on May 23 and 5-1 on June 27, It missed the playoffs last season and lost to FC Frederick in the conference semifinal in 2018. 2019 marked Philadelphia’s second playoff appearance (after missing out in each of its first five seasons); they lost to Motown in the Keystone Conference final.
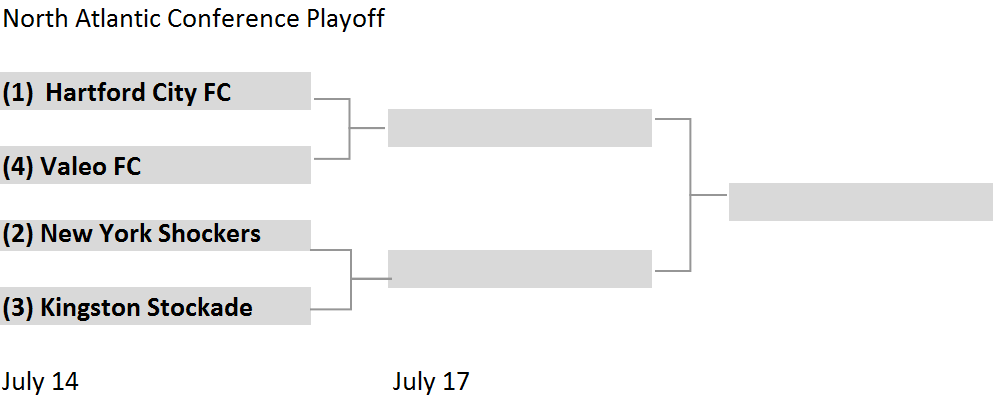
Hartford City FC vs Valeo FC: Hartford was the 1-0 on June 5 in the sole meeting between the two this season. They missed the playoffs in 2019; they lost to Kingston in the 2018 Atlantic White Conference final. Their opponents are in their debut season.
New York Shockers vs Kingston Stockade: The two clubs finished the season level on points and Kinston won the only meeting 2-0 (on June 8), but per Kingston’s twitter account Albany based Shockers get the home match due to having more in-conference wins (6 vs 5). This is the host’s first season in the league. Kingston has four previous seasons under its belt. Its only playoffs appearance came in 2017, which ended with a loss to Clarkstown SC in the Northeast Region semifinals.

Georgia Revolution FC vs Georgia Storm SA: McDonough based Revolution beat Carrollton-based Storm 0-1 on May 1 but the two clubs played to a 1-1 draw on June 5. They missed the playoffs in 2019; winning the Southeast Conference-East in 2012 advanced them to the South Region final where they lost to Chattanooga FC. Storm is in its first season of NPSL play.
Appalachian FC vs LSA Athletico Lanier: The two clubs were in a 1-1 draw on May 22 while Boone, North Carolina based Appalachian won 3-1 on June 26. Both are in the midst of their first season in the NPSL.
In order of PPG the East Region Playoff teams are: West Chester United (3) – FC Baltimore Christos (5) – Atlantic City FC (6) – Georgia Revolution (9) – FC Motown (13) – Hartford City (21) – Kingston Stockade (24) – New York Shockers (25) – Georgia Storm (30) – Northern Virginia United (32) – Appalachian FC (34) – LSA Athletico Lanier (40) – FC Monmouth (42) – Philadelphia Lone Star (45). FC Baltimore drew Philadelphia 1-1 in its July 10 regular-season finale, which hurt its PPG and cost it the inside line to the top seed in the region playoff. If the conference playoffs “go chalk”, the Region playoff would take the following form
West Region

Denton Diablos FC vs Katy 1895 FC: Denton won 2-0 on May 15 in the only meeting of the two clubs. In its 2019 debut season, they lost to Fort Worth Vaqueros in the conference semifinals. This is Katy’s first playoff appearance, which comes in the club’s third season of NPSL play.
Laredo Heat vs Midland-Odessa Sockers FC: The two clubs played to a 1-1 draw on June 17. Laredo missed the 2019 playoffs; in its first NPSL season, it lost to Little Rock Rangers in the 2018 South Region semifinals. Midland-Odessa lost to Fort Worth in the 2019 conference final. The club joined the NPSL from the USL PDL in 2017 and reached the league championship where it lost to Elm City Express.
FC Golden State vs FC Arizona: The two clubs played to a 1-1 draw on June 5. Golden State plays in Rose Hills (Los Angeles County) The club lost to ASC San Diego in the 2019 West Region quarterfinals and lost to Orange County FC in the 2018 region semifinals in its debut season. (Gilbert) Arizona lost to San Diego in the 2019 region final. Counting a 2018 play-in game, it made the playoffs in both of its two previous seasons in the NPSL.
The West Region’s PPG rankings are: Denton Diablos (8) – Laredo Heat (12) – Las Vegas Legends (20) – FC Golden State (22) – Midland-Odessa Sockers (28) – FC Arizona (33) – Katy 1895 FC (39). As such, if the higher seeds win each match, the West Region playoof would be Denton vs Las Vegas as shown below.
Midwest Region
Unlike the other regions, there are no conference playoffs and the regular season for the teams in the region ends on Saturday (when the other regions have conference finals, except for the East Region’s Keystone Conference, which is scheduled to have its final on Sunday.
The top two teams from the region’s three conferences qualify for the region playoff. The two conference champions with the higher PPG than the third receive a bye to the region semifinal. The other conference champion plays the geographically closest team among the runner-ups (regardless of seeding) in a quarterfinal match.
FC Milwaukee Torrent is the Great Lakes Champion with Carpathia FC the runner-up. Cleveland SC has won the Rust Belt and Pittsburgh Hotspurs finished second. Minneapolis City SC has won the Great Lakes Conference, but second-place is yet to be determined (Med City FC and Duluth FC are in the running; the two are level on points with Duluth holding the head-to-head tiebreaker. The seeding of the conference champions (which in turn affects the matchups will be as described above) will not be settled until Saturday. Minneapolis City had been cruising with a perfect PPG, but lost to Joy St Louis 2-3, last weekend. The loss put Cleveland as the NPSL club with the best PPG and dropped Minneapolis to second. Based on the current standings (and assuming favorites win) the Midwest Region playoff would look like this:
The four region champions advance to the national semifinals with seeding based on regular-season PPG. If we once again assume the favorites winning, final four would look like this:
The next update will be on Thursday morning, after the bulk of the conference semifinals. Your correspondent has created a Twitter list that contains accounts of the clubs that have qualified for the playoffs so that you may follow along if you so desire. All clubs are represented and most, but not all, are accounts that have been active recently.
2021 NPSL Playoffs Outlook 7/7
July 7, 2021
This weekend marks the end of the regular season for most the 76 clubs who are taking part in the National Premier Soccer League’s 2021 season. 33 of the 40 berths in the playoffs have been claimed while 15 clubs are still in the fight for the remaining seven. Fans who followed in past seasons will find the format familiar; generally speaking, conferences have playoffs that feed into regional playoffs that in turn setup national semifinals that lead to the league championship match. As always, though, the specifics are different from past seasons, particularly in terms of some conference alignments to regions.
This outlook shows how the playoffs would take place if they were to start based on today’s standings and played out with higher seeded teams winning every match. Boldfaced names indicate that a club has locked in a place in the playoffs. Italics indicate uncertainty; either the club’s seeding is subject to change or the club has not assured itself a place in the playoff. (Years in parentheses indicate when the club joined the NPSL; unless otherwise noted the club has been in continuous operation since the year listed. With the exception of a few clubs out west who started play early in the year, most had the 2020 season canceled in its entirety).
South Region
Jacksonville Armada U-23 (2011-2015 as Jacksonville United; 2016-2017,2018 as Jacksonville Armada,2019-) have clinched the top seed in the Gulf Coast Conference that was created in 2020. Newly formed Southern States SC currently holds the second seed but Pensacola FC who joined the NPSL this season from the Gulf Coast Premier League (and was a member of the NPSL as Pensacola City FC in 2013) can still claim the home semifinal match for itself. New Orleans Jesters (2013-2018, 2020-), is likely to claim the final seed on offer. A win or draw versus Florida Roots on Saturday puts them in the playoffs; a loss combined with an AFC Mobile (2020) defeat of Tallahassee SC (2020) would put the former GCPL team in at New Orleans’ expense.
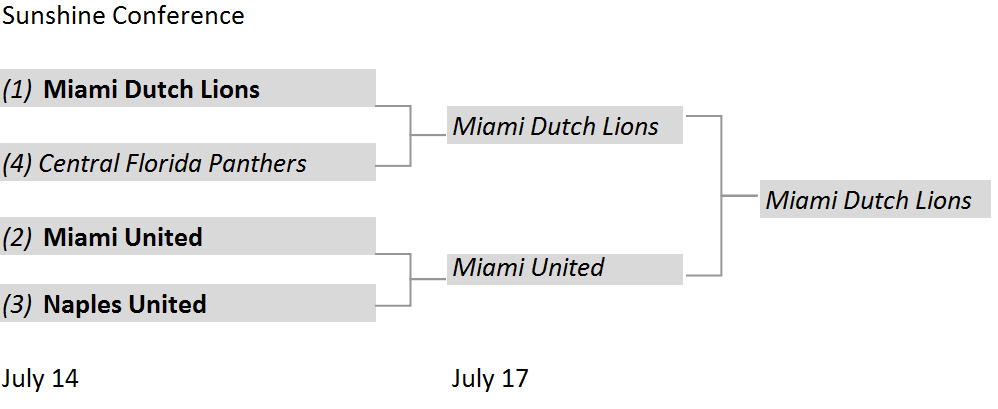
Miami Dutch Lions (2016-2018 as Houston Dutch Lions, moved to Miami in 2019, re-joined NPSL in 2020) currently leads the Sunshine Conference. Miami United (2013),is still in contention for the top seed as is Naples United (2017). Central Florida Panthers (2019) is ahead of Boca Raton (2017-2018, 2021-) for the fourth seed; the two clubs face each other on Saturday.
In the Heartland Conference, Springfield MO side Demize (2014-2016 as Joplin Demize, 2017-), is likely to clinch the top seed on Saturday as they face hapless Dallas City FC (2014-2017, 2019, 0-0-9, -51 goal differential) on Saturday. Tulsa Athletic (2013) and OKC 1889 (new this season from the UPSL) have clinched berths while (Little Rock) Arkansas Wolves (new, also from UPSL) hold the fourth seed over Reign FK (Bartlesville, OK , also new).
The winners of the conference playoffs advance to the South Region playoff. The club with the highest regular season points per game (PPG) average receives a bye and is in the region final while the club with the second best PPG hosts the third club for a region semifinal match. If the best teams win, Jacksonville would have the bye while Demize would host Miami Dutch Lions.
East Region

All Keystone Conference playoff berths have been claimed, but the seeding is not entirely set. West Chester United SC (2017) is one point ahead of Atlantic City FC (2018); the two clubs play separately tonight with Atlantic City holding the head-to-head tiebreaker due to a 4-2 victory earlier this season. Morristown, New Jersey side Motown FC (2012-2016 as Clarkstown SC Eagles; Motown FC 2017-) who played in the 2018 league championship is locked into the third seed while FC Monmouth (2018) has claimed the last berth.
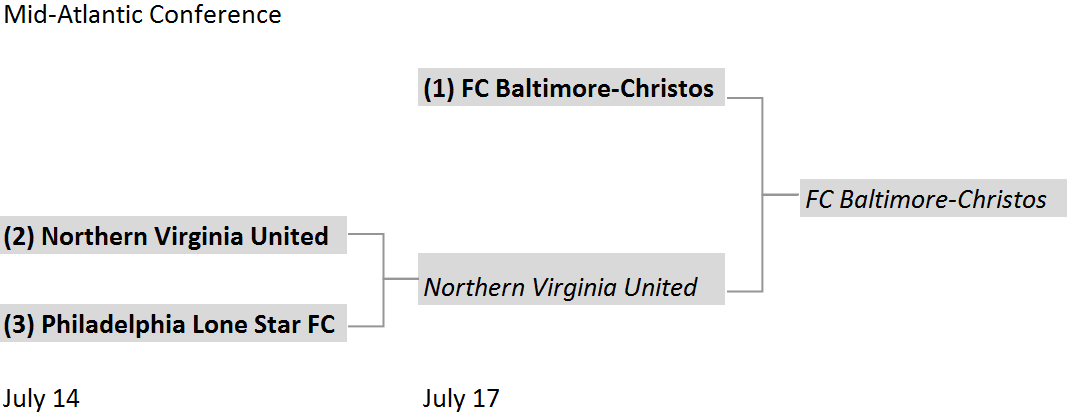
Though there remains one regular season match to play for the teams in the playoffs, the seeding for the Mid-Atlatnic Conference playoff is set. FC Baltimore-Christos (2018) has a bye to the conference final while Leesburg side Northern Virginia United (2018) will host Philadelphia Lone Star (2012-2014, 2016-) in the semifinal.
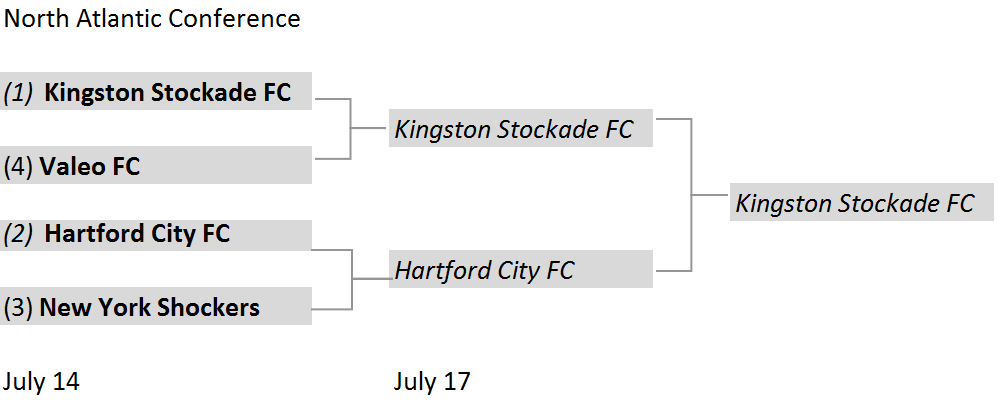
All North Atlantic Conference playoff berths have been taken, but the top seed is yet to be claimed. Kingston Stockade (2016) is two points ahead of Hartford City FC (2017) . They travel to New York Shockers (2012) on Saturday (with Kingston having beat them 2-0 at the start of the season) while Hartford travels to hapless Greater Lowell Rough Diamonds (2017). Newton, MA side Valeo FC (2021) is locked into the fourth seed.
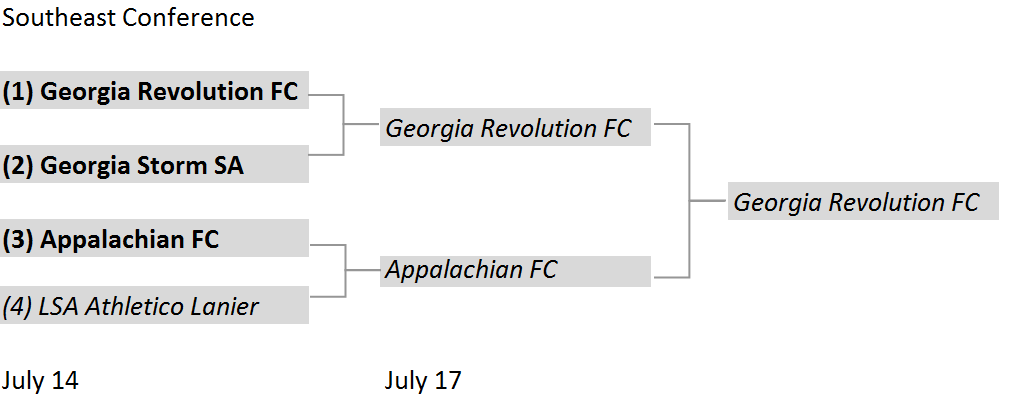
Part of the South region in past seasons, the Southeast Conference is aligned to the East Region this year. (McDonough) Georgia Revolution (2011) has the top seed while (Carrolton) Georgia Storm (2021) is second and Boone, NC side Appalachian FC (2021) is third. LSA Athletico Lanier (Gainesville GA, 2020) is three points ahead of Metro Louisville (2020). The two play on Saturday with Athletico having beaten Louisville 2-1 earlier this season. FC Baltimore-Christos, who had a perfect PPG average until inclement weather forced a shortened match against Northern Virginia United that ended as a 0-0 draw, currently boasts the best average of the would-be regional playoff teams. With one loss, West Chester United is right behind them.
West Region
Due to local pandemic restrictions, the number of teams in the region is greatly reduced in 2021. Unlike past seasons, the Southwest Conference started play at the same time as other conferences rather than earlier in the year. Las Vegas Legends (2020, formerly of Major Arena Soccer League 2012-2016) is one point ahead of FC Golden State (2018, Rose Hills, CA) and two in front of FC Arizona (2017). Golden State plays its regular season final tonight while Las Vegas and Arizona play separately on Saturday.
Usually part of the South Region, the Texas based Lone Star Conference falls under the West this season. Denton Diablos (2018) is currently leading with Laredo Heat (2018, USL PDL member 2004-2015) two points behind. 2017 league runner-up Midland-Odessa (2017, 2009-2016 in the USL PDL) is third. Temple side Coyotes SC (2020, from UPSL) currently holds the last seed, but Katy 1895 (2018) and Irving FC (2021) are still in contention. Coyotes travel to Laredo on Friday while Katy plays seventh place FC Brownsville (2018,2020-) and Irving travels to last-place Forth Worth Vaqueros on Saturday.
Absent a super upset in the Lone Star Conference playoff, the road to the West Region final runs through Texas as the competitive nature of the Southwest conference depressed the PPG of its teams.
Per usual, there are no conference playoffs in the Midwest Region. Instead, the top two teams from the three constituent conferences (Great Lakes, Rust Belt, and North) compete in a six-team regional playoff. The two clubs with the highest PPG get a bye to the semifinal while the remaining conference champion hosts whichever second-place club is nearest (regardless of seeding). At this time, Minneapolis City SC (2017) of the North Conference has a perfect PPG average while Rust Belt representative Cleveland SC (2018) also boasts one of the best averages in the league. Maintaining that average would leave FC Milwaukee Torrent (2016-2018,2020-) of the Great Lakes Conference as the third seed. They would host Rochester, MN side Med City FC (2017) while Carpathia FC of Detroit (2020, from UPSL) would travel to Pittsburgh Hotspurs (2019). All of the teams less Med City and Carpathia have clinched berths; Duluth FC (2017) continues to chase Med City for second place in the North Conference and FC Columbus (2018) still has an oustide chance of reeling in Carpathia for second in the Rust Belt. The regular season for the teams in this region ends on July 17; most clubs have two matches left to play. As such, this bracket is very much in flux.
The winners of the four region playoffs advance no the national semifinals with the two clubs possessing the highest regular-season PPG getting to host the other two clubs. As such, as of today, if the playoffs were to go to form, Minneapolis City with its PPG would host Denton Diablos and Jacksonville Armada U-23 would travel to FC Baltimore-Christos for the July 31 semifinal matches. The winners would then p lay for the NPSL title on August 7.
The next update will be posted after most conferences conclude their regular season on Saturday night.
2020 Atlantic Storm Names
June 1, 2020
Today is the official start of hurricane season in the Atlantic basin. We start the season with two names already marked off the list (See you in 2026, Arthur and Bertha!), For the first time since 2015 (and the last time for the foreseeable future), we do not have any new names on the roster. The National Hurricane Center issued its first regularly scheduled Tropical Weather Outlook this morning. As usual, it includes the list of names for this season along with their pronunciations. As usual, I have my notes on the past iterations of these names.
This year’s list was first used in 1984. Nine original names have been retired, which is the average (1981, with 11, holds the record for the most). As is the case for half of the lists, the name beginning with the letter I has been replaced twice. There are five names original to the list that remain yet been used.
Arthur – With only one exception, the name has been associated with only a tropical storm. The 1984 edition was a weak tropical storm east of the Lesser Antilles. The 1990 version was stronger and crossed into the Caribbean. In 1996, the storm named Arthur made landfall in North Carolina before curving back to sea. In 2002, the cyclone formed east of North Carolina and headed to Newfoundland. The 2008 version formed from the remnants of Pacific Tropical Storm Alma (and made landfall in Belize. In 2014, there was finally a Hurricane Arthur. It made landfall in North Carolina on July 4. 2020’s Arthur developed over the Gulf Stream and made a close brush with the Outer Banks.
Bertha – For Americans, this might be the most notorious name on the list. While the 1984 edition was a weak tropical storm at sea, 1990‘s Bertha was a category one hurricane that made landfall in Nova Scotia. In 1996, it was a major hurricane that made landfall in North Carolina as a category one (Particularly memorable for me as my father and I drove around the periphery of it post-landfall as we traveled from Tallahassee to Chesapeake, VA. A downed limb on US 17, east of the Great Dismal Swamp, caused a tire blow-out and quite the soaking for us when we changed the tire in the dark.) 2002‘s Bertha was a weak tropical storm that made landfall in southeast Louisiana while the 2008 iteration was the longest-lived and eastern-most forming July tropical cyclone on record. 2014‘s Hurricane Bertha was more forgettable (though in extratropical life, the storm did have a substantial effect on Europe). 2020 Bertha will be remembered for its quick and rather unexpected formation. At 12:50 AM on May 27, the Tropical Weather Outlook projected a 30% chance of tropical cyclone formation and that probability went up to 70% with a 7:25 AM forecast. The National Hurricane Center initiated advisories just over an hour later for the one day storm.

Big Bertha
Cristobal – Replaced Cesar after 1996. The 2002 edition was a weak tropical storm at sea, while 2008‘s formed east of North Carolina and traveled northeast. In 2014, Cristobal produced heavy rains over some Caribbean islands but was otherwise un-notable.
Dolly – Replaced Diana after 1990. The inaugural edition made landfall in Mexico as a category 1 hurricane in 1996. In 2002, it was a tropical storm at sea, while in 2008 it was a landfalling hurricane once again; this time on the Yucatan Peninsula and south Texas. The 2014 version was a short-lived Bay of Campeche storm.
Edouard – In 1984, the storm had a quick life and death in the Bay of Campeche. In 1990, it was a tropical storm that meandered around the Azores. It was the strongest hurricane (category four) of the 1996 season and threatened New England before curving away. The 2002 edition made landfall in Ormond Beach, Florida as a tropical storm while 2008‘s struck Texas. The 2014 version remained at sea but marked the first time NOAA used unmanned aircraft systems to collect data in a hurriane.
Fay – Replaced Fran after 1996. The tropical storm of 2002 hit near Matagorda, Texas. In 2008, the storm crossed over Hispanola and Cuba before making four landfalls in Florida (at Key West, Naples, Flagler Beach, and Carabelle). The 2014 hurricane made landfall on Bermuda at category one strength.
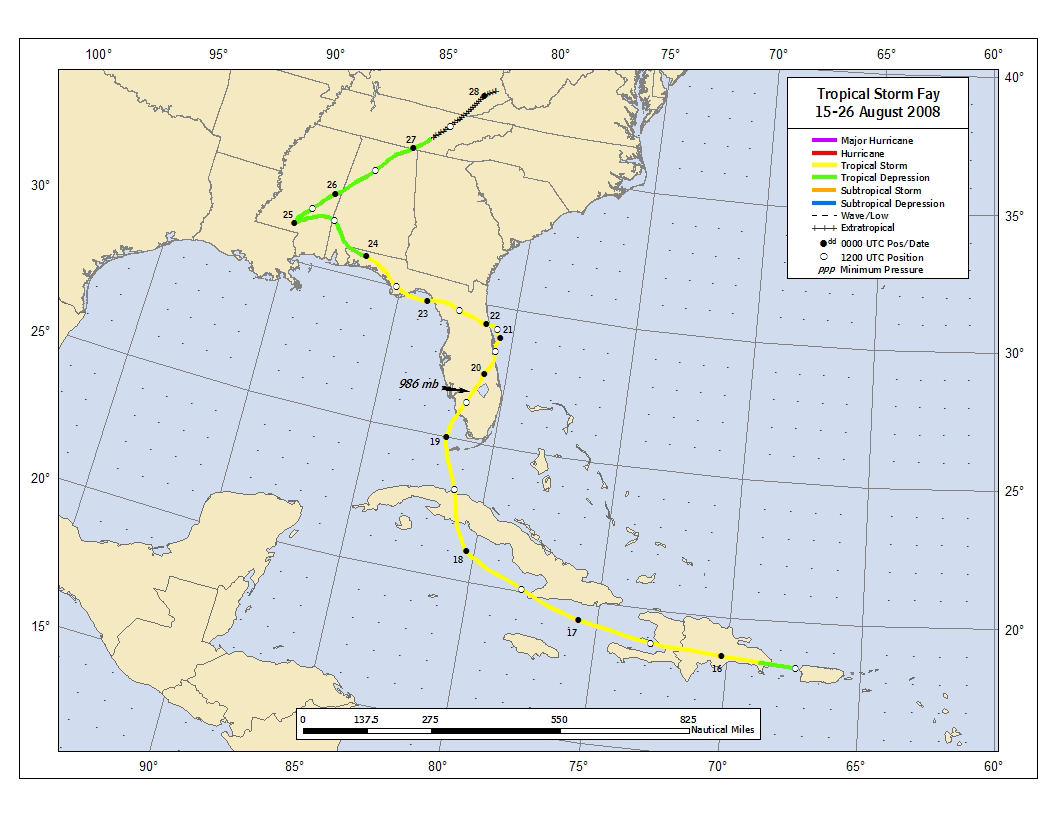
Fay liked Florida
Gonzalo – Made its debut in October of 2014 and affected a number of the Leeward Islands as well as Bermuda, where it made landfall just six days after Fay.
Hanna – Replaced Hortense after 1996. In 2002, it was a tropical storm with landfalls at the mouth of the Mississippi River and the Alabama/Mississippi border. The 2008 hurricane made landfall near the North Carolina/South Carolina border and worsened flooding in Haiti, which had already been affected by Fay and Gustav. Were it not for the latter, the name Hanna likely would have been retired. The 2014 version was a strange affair. The preceding tropical depression formed out of the remnants of Pacific Tropical Storm Trudy in the Bay of Campeche and travelled east. It degenerated to a remnant low before coming back to life east of the Nicaragua/Honduras border and became a tropical storm just before making landfall in Nicaragua.
Isaias – This name was added to the list after the 2008 season to replace Ike, which had replaced Isidore after 2002. It was not used in the 2014 season so it still has has a chance to join Igor and Irma on the list of ‘I’ storms that were retired after just one appearance.
Josephine – In 1984, it was a category two hurricane at sea, while 1990‘s was a category one. The 1996 tropical storm tracked east across the Gulf of Mexico and made landfall in an uninhabited part of Taylor County, Florida. The 2002 and 2008 versions were tropical storms at sea (though remnants of the latter did bring flooding to St Croix).
Kyle – Replaced Klaus after 1990. In 1996, it was a short-lived tropical storm off the coast of Central America. In 2002, it was a wayward hurricane that ultimately hit the Carolinas while curving to the northeast and subsequently absorbed by a cold front. The 2008 edition was also a hurricane and made landfall near Yarmouth, Nova Scotia.
Laura – Replaced Lili after 2002. It was a north Atlantic tropical storm in 2008.
Marco – It was the only tropical cyclone to make landfall in the United States (near Cedar Key, Florida) in 1990. It was a wayward hurricane in the Caribbean Sea in 1996. The 2008 version was a small tropical storm in the Bay of Campeche.
Nana – 1990 marked the first time that a storm name starting with the letter N made an appearance; it was a hurricane at sea. The 2008 version was a short-lived tropical storm at sea.
Omar – In 2008, it was a category four hurricane, which formed in the Caribbean Sea and moved to the northeast before eventually dissipating west of the Azores.
Paulette – Replaced Paloma after the 2008 season.
Rene, Sally, Teddy, Vicky, and Wilfred have never been used. If the higher-end of some of the season forecasts are correct, we will see (at least) some of them for the first time in 2020.
Jacksonville Armada’s league debut 5 years later – Where did the players and coaches go?
April 4, 2020
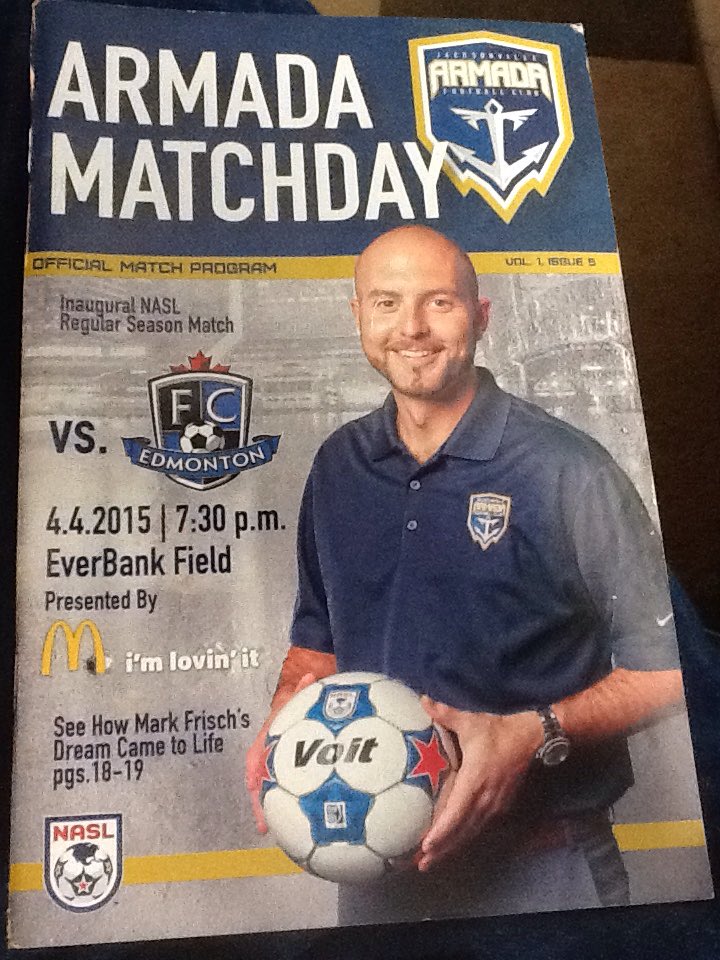
Today marks the fifth anniversary of Jacksonville Armada’s first league match. Here is a quick look at what happened next in the careers of the starting eleven as well as those of the “Co-Head” coaches.
Miguel Gallardo – The goalkeeper’s two seasons in Jacksonville marked the end of his (outdoor) playing career. He has since been a broadcaster and community ambassador for his former club, Orlando City.
Lucas Rodriguez – Transfermarkt does not show the Argentine midfielder playing for another club after leaving Jacksonville in 2015.
Lucas Trejo – The Argentine defender left Jacksonville after 2015 and had two stints in Venezula with top-flight squads Monagas SC and Deportivo Táchira and a stay with Colombia’s Atlético Huila in between. At the start of 2020, he signed with Acenso MX side Zacatepec. His 70 league appearances with Monagas and 34 with Táchira exceed the number made with Jacksonville (24); one of only two players from the eleven to make more appearances with a single club after leaving Jacksonville than made in Jacksonville.
Fabricio Ortiz – Like his compatriots on the back line, he departed the river city in 2015. He played in Jordan and India before joining second-tier Ecuadorian side Atletico Porteño last year. Oriz is now with Club Sportivo y Biblioteca Atenas in a regional Argentine league.
Matt Bahner – The defender left Jacksonville after the 2016 season and spent two seasons with then USL side Cincinnati before moving to St. Louis FC for the 2019 season. He was one of four former Cinicnnati players on the squad that gained revenge on their old team in the 2019 US Open Cup. Bahner’s total number of appearances in league matches with his subsequent clubs (53) is slightly greater than that he made with Jacksonville (46).
Lucas Scaglia – Played under Eric Wynalda for the LA Wolves (UPSL) in 2017. Re-joined Wynalda with Las Vegas Lights (USL Championship) in 2019 but made only nine appearances before telling the team of his retirement in August.
Jaime Castrillon – Like so many of his teammates, the Colombian midfielder spent only one year in Jacksonville. He spent a season with Atlético Bucaramanga in his home country (top-flight) in 2016. In January of this year, Orlando SeaWolves (Major Arena Soccer League) announced his signing.
Angel “Bochy” Hoyos – The coach’s son had a brief stay with Venezuelan side Aragua FC in 2016. Transfrmarkt then shows him joining second tier Venezuelan side Libertador in 2018 and still with the club at this time.
Jemal Johnson – Jacksonville’s first goal scorer also scored the first goal in the history of his next club, Fresno FC, in 2018. In the course of 59 matches, he put the ball in the back of the net on 16 occasions. The club folded after the 2019 season with its last match being a 2-3 defeat to El Paso Locomotive in the Western Conference quarterfinals of the USL Championship playoffs, leaving Johnson 15 league appearances short of his total in Jacksonville.
Marcos Flores – Another player with only a one year stay in Jacksonville. He was with Curicó Unido (Chile) and Persib Bandung (Indonesia) in 2016 and Bali United (also Indonesia) in 2017 before settling in Australia with Adalaide City FC in 2019. His 26 appearances with Bali slightly exceeded the number he made with Armada FC (22). He has been active in his community running coaching clinics and the like through his organization Playmakers Trainers.
Alhassane Keita – Jacksonville’s all-time leading goal scorer left after two seasons and after an interlude with Saudi club Al-Watani made a brief return during the club’s fourth season during which he added three goals to his earlier tally of 13.
As for the coaches, recall that Jose Luis Villareal and Guillermo Hoyos were “Co-Coaches” at the start of the 2015 season, but did not remain so for long. Villareal’s departure from Jacksonville at the end of June had been announced in May. In October 2019, debuting UPSL side Miami Beach CF named Villareal as its head coach (he apparently has had no coaching work in between).
Despite having signed Hoyos to an extension “through 2019” in June, Jacksonville fired him only a few months later (September 2015). He briefly was the manager of Oriente Petrolero (Bolivia) and of the Bolivian national team in 2016. He had a longer stay with Club Universidad de Chile (January 2017-April 2018) before moving to Liga MX side Atlas (September 2018-March 2019). He became the manager of Aldosivi (Argentine top flight) in October 2019.
The Books I Read in 2019
January 8, 2020
Unlike some years past, I didn’t really go into the year with any areas towards which I intended to focus my reading. I just had vague goal of reading more books than I did in 2018 and later in the year, I became focused on reducing the stupidly long queue of unread books in my possession. The latter goal (which has entailed on not buying any books since September) caused a fair bit of randomness in my reading as some of those unread books were either ones that I had not bought or asked for or I had bought on a whim.
I read 45 books last year, which met the goal of reading more, but only somewhat helped shorten the queue of unread books. These are the books:
Iran
In 2018, I read 25 books of varying scopes that were related to Iran. I still had some “left-overs” from that project and also added a book that was published early in 2019.
Daughter of Persia by Sattareh Farman Farmaian – If the recent troubles have caused you to want to read up on Iran, then I cannot recommend this book enough. The reader gets a very fascinating personal story and gets a very good history lesson as a matter of course. As a cousin of Mohammed Mossadegh, she offers a unique perspective on the events of 1953 (which she experienced in the United States as the employee of an oil company). Had I realized how good this book was, it most certainly would not have been a “left-over”.
My Uncle Napoleon by Iraj Pezeshkzad, translated by Dick Davis – This was a 2018 Christmas present from my sister. Very funny novel.
Prisoner by Jason Rezaian – Memoir by the Washington Post journalist who spent 544 days in an Iranian prison. Riveting and entertaining read.
Kissing the Sword by Sharnush Parsipur – Prison memoir by the author of Women Without Men. IIRC, she went to prison on four separate occasions, one of them was because of that book.
Abbas Kiarostami by Mehrnaz Saeed-Vafa and Jonathan Rosenbaum – My 2018 project also got me into watching a fair amount of Iranian movies (which I’m still doing). Those movies included (more or less) the complete works of Kiarostami.
Women’s Soccer
Mostly as a consequence of the Women’s World Cup, of course.
I Lost My Heart to the Belles by Pete Davies – A really fun book that was written contemporaneously in the mid 90’s but now is a great “time capsule” of what “top-flight” women’s soccer was like in England. Teams composed of players with day jobs that played on substandard fields (and only when those fields were playable). A future England legend makes a bit of a cameo appearance as a member of one of the Belles’ opponents.
The National Team by Caitlin Murray – A book about the US Women’s National Team in advance of the World Cup (and updated in a paperback version). I left a review on the website.
The Making of the Women’s World Cup by Kieran Theivam and Jeff Kassouf – Another book published in advance of the WWC. I left a review for it as well (Note that I accidentally bought the book from UK Amazon; it is available from US Amazon).
Under the Lights and in the Dark by Gwendolyn Oxenham – Nice look at what women’s soccer is like in different parts of the world.
The Beautiful Game by Jonathan Littman – A season with an American girls’ soccer team in the late 90’s (pre-1999). It would be fun to read a similar book in the present.
Futbolera by Brenda Elsey and Joshua Nadel – Not just soccer, but women’s sports in general in Latin America (though soccer is most covered).
Hope by Hope Powell – Memoir by the long-time coach of the English WNT (I believe this is only available through UK Amazon).
Men’s Soccer
A Bigger Field Awaits Us by Andrew Beaujon – The fascinating story of the Hearts of Midlothian squad that (more or less as a whole) saw combat in World War I.
What We Think About When We Think About Soccer by Simon Critchley – Waxing philosophical about soccer.
The Numbers Game by Chris Anderson and David Sally – Finding truth in soccer via statistics.
Twelve Yards by Ben Lyttleton – As the subtitle says “The Art and Psychology of the Perfect Penalty Kick”.
The Illustrated Football Hall of Fame – Very funny, but one of those things where you feel like you really have to know your history to “get” each and every gag.
Babysitting George by Celia Walden – Not really a soccer book; covers a few months in the last year of the life of Manchester United legend George Best and ends up being about the nature of tabloid journalism as much as anything.
The Title by Scott Murray – A season by season account of England’s old First Division.
Mark Twain
A long long time ago I started buying books that are part of the Oxford Mark Twain collection, a set of 29 reproductions with new introducing and concluding essays. A long time ago I finished buying the collection and set about reading it in chronological order. All but finished.
Christian Science (Amazon’s description) “An amusing assault on Christian Science’s more extravagant claims to cure illness and on founder Mary Baker Eddy’s obfuscating writing style.”. Yeah, sure.
Chapters From My Autobiography
Extract From Captain Stormfield’s Visit to Heaven
Speeches Not part of the count as I haven’t actually finished it yet, though I am ~95% there.
Auto Racing
Hobbo by David Hobbs – Memoirs by the longtime commentator of Formula 1 races broadcast in the US (among other things). He had an interesting and wandering career as a driver before getting into the television. Worth it for the pictures alone (though the writing is good, too!).
How to Build a Car by Adrian Newey – Memoir by the brilliant aerodynamics mind for Red Bull Racing. Ended up being a more fun read than I anticipated.
Where the Writer Meets the Road by Sam Posey- Collection of articles and TV voiceovers by a on-track rival of Davis Hobbs; the two ended up doing a fair amount of TV work together over the years.
Gifts and other random accumulations
Adventures in the Screentrade by William Goldman – I bought this in the immediate wake of Goldman’s death. Very entertaining and informative.
The Brass Ring by Bill Mauldin – Recollection of the childhood and wartime service from the Pulitzer Prize winning cartoonist.
Armenian Golgotha by Grigoris Balakian and Peter Balakian – Memoir by an Armenian priest who survived the Armenian Genocide. One of those books that should be read by more people.
Never Broken by Jewel – Worth reading even if you aren’t a fan of the singer.
Misbehaving by Richard Thaler – I’m a sucker for anything about Behavioral Economics.
The Secret History of World War II by Neil Kagan, Stephen G. Hyslop, et al. Fun book. Some parts I knew very well (Enigma), others (covert operations), not so much.
The Big Bad Book of Bill Murray by Robert Schnakenberg – A must read if you are a fan of Bill Murray in general or any of his movies in particular.
The Way to Paradise by Mario Vargas Llosa – Somehow I only read one book by the Peruvian Nobel Prize winning novelist. I’m still a few books away from having read everything of his that’s been published (in English).
A Passion for Leadership by Robert Gates – I couldn’t pass over a book by Robert Gates (I loved Duty) but I ended up feeling like I could have left this unread. Felt like I would have gotten a lot out of it if I were the head of a large organization, but I am not, alas.
Radical Chic and Mau-Mauing the Flack Catchers by Tom Wolfe – I had read this (and have read most of Wolfe’s work before) but I intend to read through all of his books.
Oceans Ventured by John Lehman – Story of the 1980’s Cold War Navy written by the Secretary of the Navy at the time. Very entertaining.
Democracy by Condolezza Rice
Mastros and Their Music by John Mauceri – The art of conducting as described by a conductor who learned from Leonard Bernstein (among others). Another book that I enjoyed more than I anticipated.
100 Minds That Made the Market by Ken Fisher – Profiles of 100 bankers, investors, journalists, and scoundrels who made Wall Street what it is.
Things That Matter by Charles Krauthammer – Collection of columns from the late Washington Post scribe.
The Ultimate Ambition in the Arts of Erudition by Shihab al-Din al-Nuwayri and Elias Muhanna – A (very) condensed translation of a 14th century Egyptian encylopedia of everything.
Entebbe Rescue by Yeshaʻyahu Ben Porat – Account of the daring hostage rescue. There may be a better/more thorough account out there now, but this book written not long after the event would seem to still be worthwhile to pickup if you come across it in a used book store and don’t know much about it.
Robert the Bruce – by Ronald McNair Scott
Sea Stories by William McRaven – A 2019 Christmas present. I read it in one sitting on Christmas Day. Strong book on which to finish my reading for the year.
I go into 2020 with a healthy number of unread books to knock out before buying any new ones (clearing the queue would put me ~halfway to equaling the number of books I read in 2019). There’s a good amount of soccer still to read (men’s, women’s, and Liverpool Football Club specifically) and an equal number of “random” books. I’ll probably get in to the three volume Mark Twain autobiography, each volume of which my sister gifted to me at the time of publication, which was… a little while ago.
